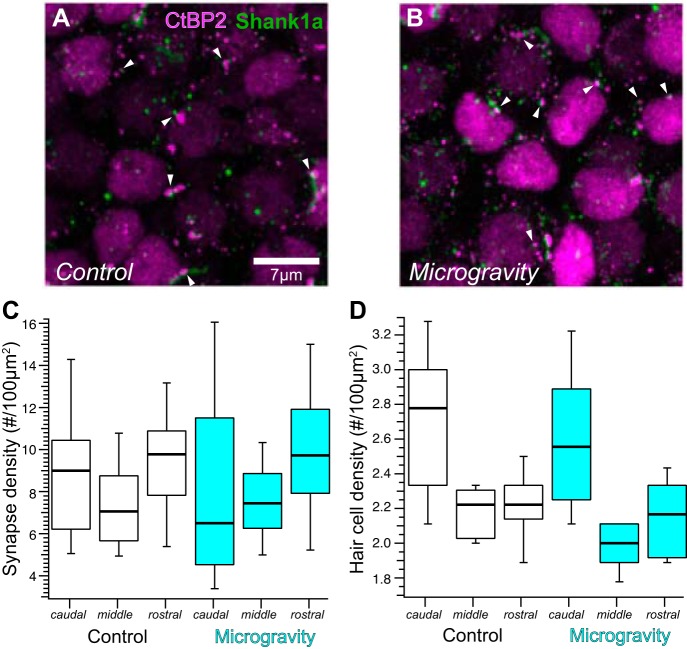
Fig. 5.
Synapse distribution in striolar regions of control and microgravity utricles. A and B: maximum-intensity projection micrographs representing confocal stacks from middle striolar regions in immunolabeled control (A) and microgravity utricles (B). Closely apposed CtBP2- and Shank1a-positive puncta (examples highlighted by white arrowheads) are observed throughout the micrographs. Synapses are clearly less dense in these striolar micrographs compared with those from medial extrastriola (Fig. 4). C: box-and-whisker plots of synapse densities (synapse count per 100 µm2) in caudal, middle, and rostral (Fig. 2A) striolar regions of control and microgravity specimens. Synapse densities in the striola were similar among all specimens regardless of gravitational condition. D: hair cell densities (hair cell count per 100 µm2) among the 3 striolar regions in control and microgravity specimens are illustrated in box-and-whisker plots. Hair cell densities across gravitational condition were similar.

