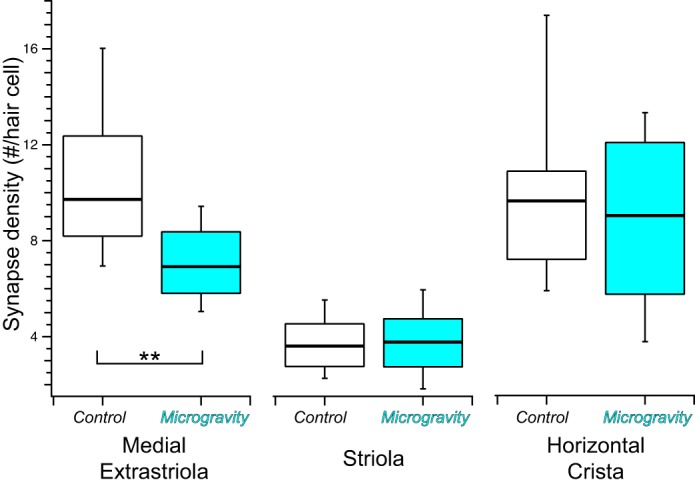
Fig. 8.

Summary box-and-whisker plots of synapse densities (number of synapses per hair cell) in vestibular epithelia from control and microgravity mice. Synapse density per hair cell was lower in the medial extrastriola in microgravity specimens compared with controls (**P = 0.0027), whereas comparable measures were similar in the 3 striola regions (P = 0.85) and the planar region of the horizontal crista (P = 0.48).
