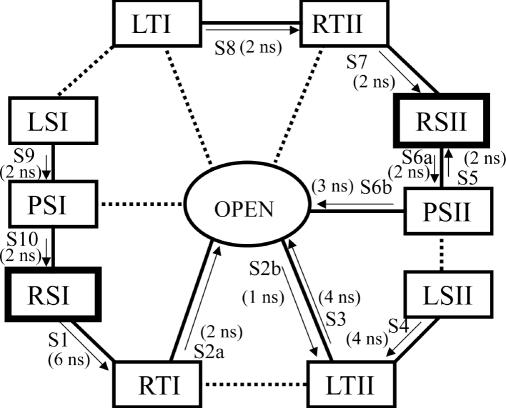
Figure 3.
Schematic framework proposed for the conformer transition. A line between two conformations denotes a possible transition step. A solid line is used when the step has been directly observed in our MD simulations, S1–S10. The arrow indicates the direction of the step. A dotted line is used when the step was not observed in the simulation, but can be deduced by symmetry from an analogous step observed in our MD simulations. The approximate time each transition step lasted in a simulation is indicated in ns. S3 and the other simulation from the open form (data not shown) were performed in the presence of magnesium ions (0.2 M ionic strength of sodium, chloride and magnesium ions together); further simulations were performed in the absence of magnesium ions (0.1 M ionic strength of sodium and chloride ions).

