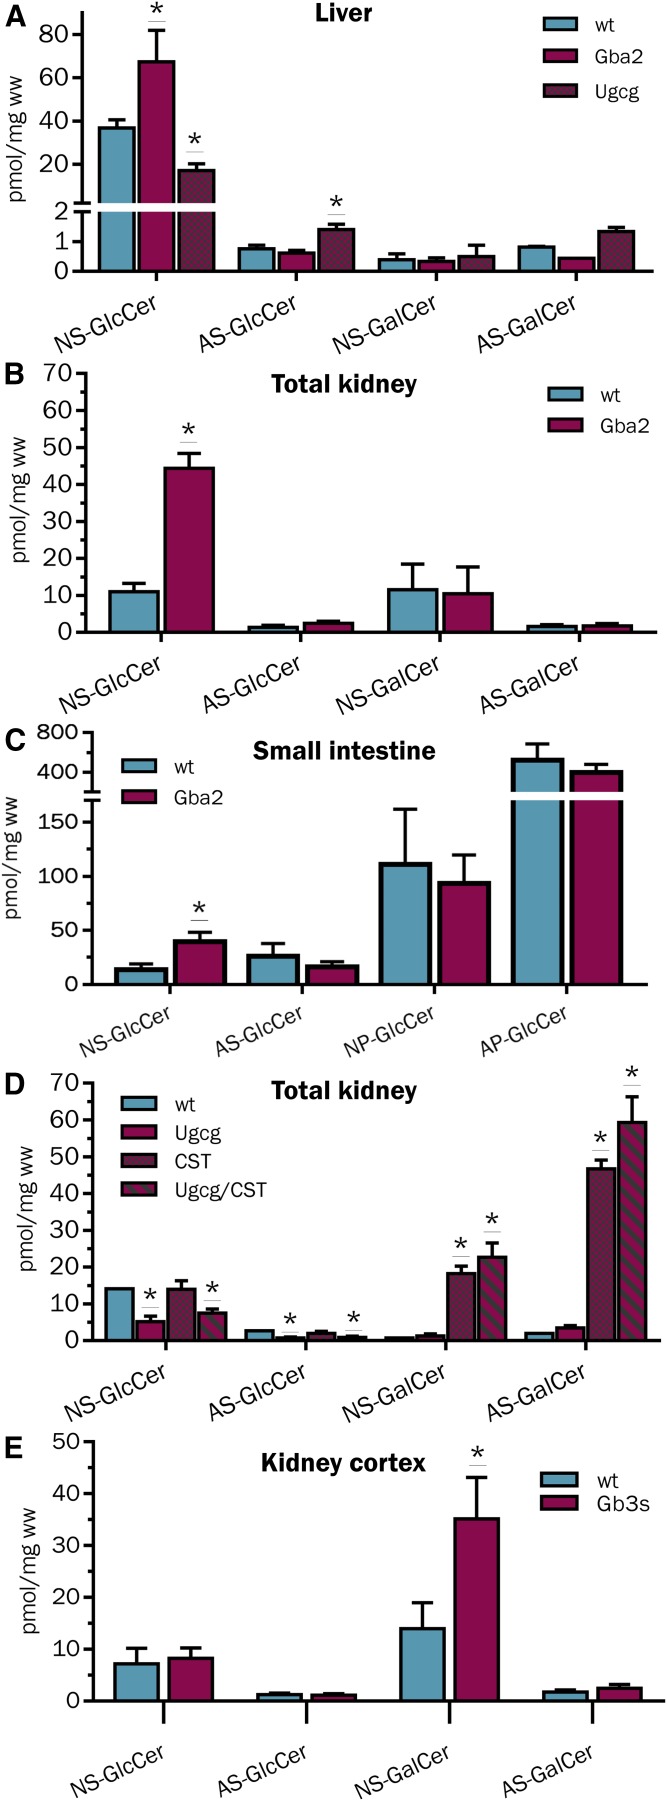
Fig. 4.
HILIC-MS2-based quantification of β-GlcCers and β-GalCers in liver of WT, Gba2−/−, and Ugcgf/fAlbCre mice (A); kidney of WT and Gba2−/− mice (B); small intestine of WT, and Gba2−/− mice (C); kidney of WT, Ugcgf/fPax8Cre, CSTf/fPax8Cre, (Ugcg and CST)f/fPax8Cre mice (D); and in kidney cortex of WT and Gb3s−/− mice. Note the specific increase of NS-β-GlcCer in liver, kidney and small intestine of Gba2−/− mice, the selective decrease of NS-GlcCer in liver and of NS- and AS-GlcCer in kidney of Ugcgf/fAlbCre and Ugcgf/fPax8Cre [and (Ugcg and CST)f/fPax8Cre] mice, respectively (E). Vice versa, NS- and AS-β-GalCer accumulates in kidneys with CST-deficiency [CSTf/fPax8Cre and (Ugcg and CST)f/fPax8Cre] as well as NS-β-GalCer in cortex of Gb3s−/− mice. n ≥ 3, except for (D) WT = 1.

