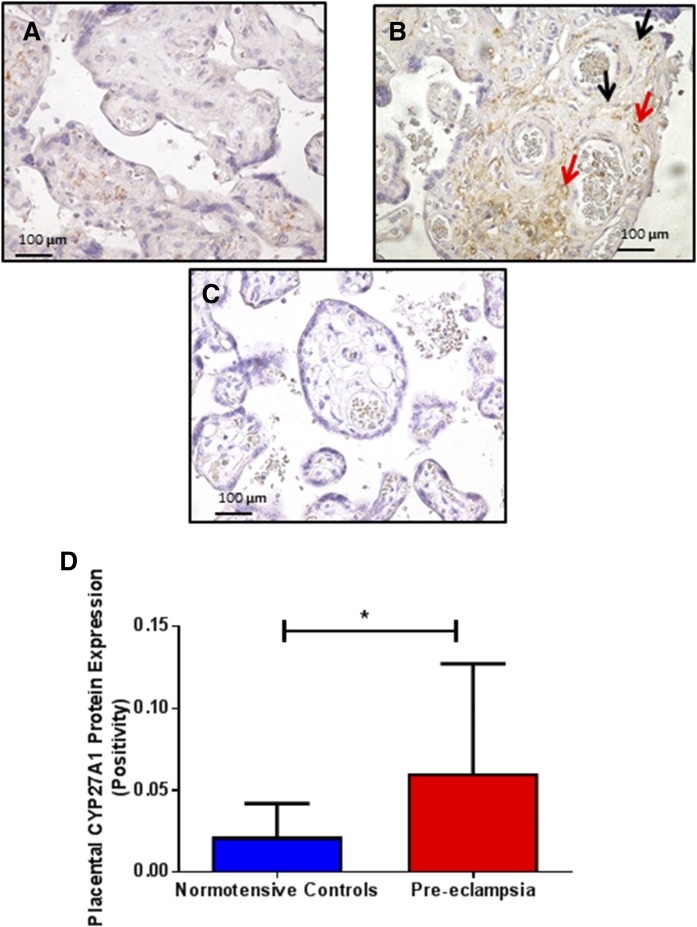
Fig. 4.
Localization and quantification of placental CYP27A1 immunostaining in placentae from normotensive controls (NC; n = 17) (A), preeclampsia (PE; n = 17) (B), and negative control (C). In photomicrographs, positive cells appear in brown; magnification ×400. Protein expression was localized to Hofbauer cells (black arrows) and fetal vessels (red arrows). In the graph (D), data are represented as mean ± SD; *P < 0.05.

