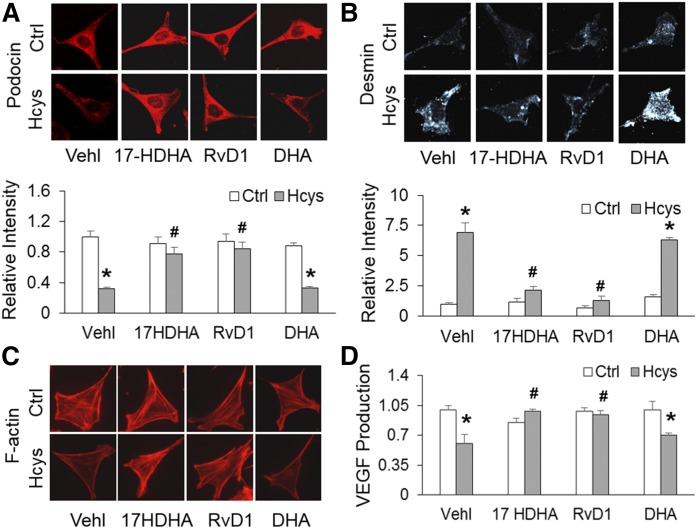
Fig. 3.
DHA LOX metabolites prevented Hcys-induced podocyte injury. A: Representative images and summarized data showing the expression of podocin in different podocytes that were cultured and treated on different days (n = 6). B: Representative images and summarized data showing the expression of desmin in different podocytes that were cultured and treated on different days (n = 6). C: Images showing the expression of F-actin fiber in different podocytes that were cultured and treated on different days (n = 5). D: Summarized data showing production of VEGF in different podocytes that were cultured and treated on different days (n = 4). *P < 0.05 versus Ctrl-Vehl group, #P < 0.05 versus Hcys-Vehl group. Ctrl, control; Vehl, vehicle.

