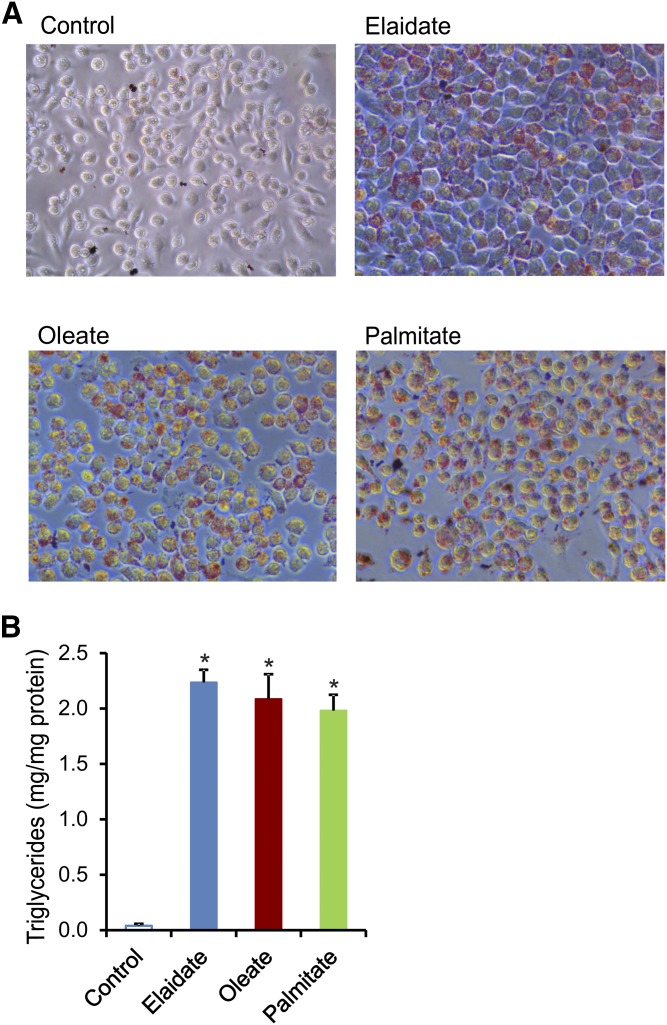
Fig. 4.
Similar lipid content in RAW264.7 macrophages treated with different FAs. RAW264.7 macrophages were treated with 500 μM of individual FAs (palmitate, oleate, or elaidate) or vehicle control for 6 h. A: Representative images of oil red O staining of lipid droplets in RAW264.7 macrophages. B: Intracellular triglyceride quantification after FA treatments. Error bars represent SD. Asterisks indicate statistically significant relative to vehicle control (*P < 0.05).

