Fig. 5.
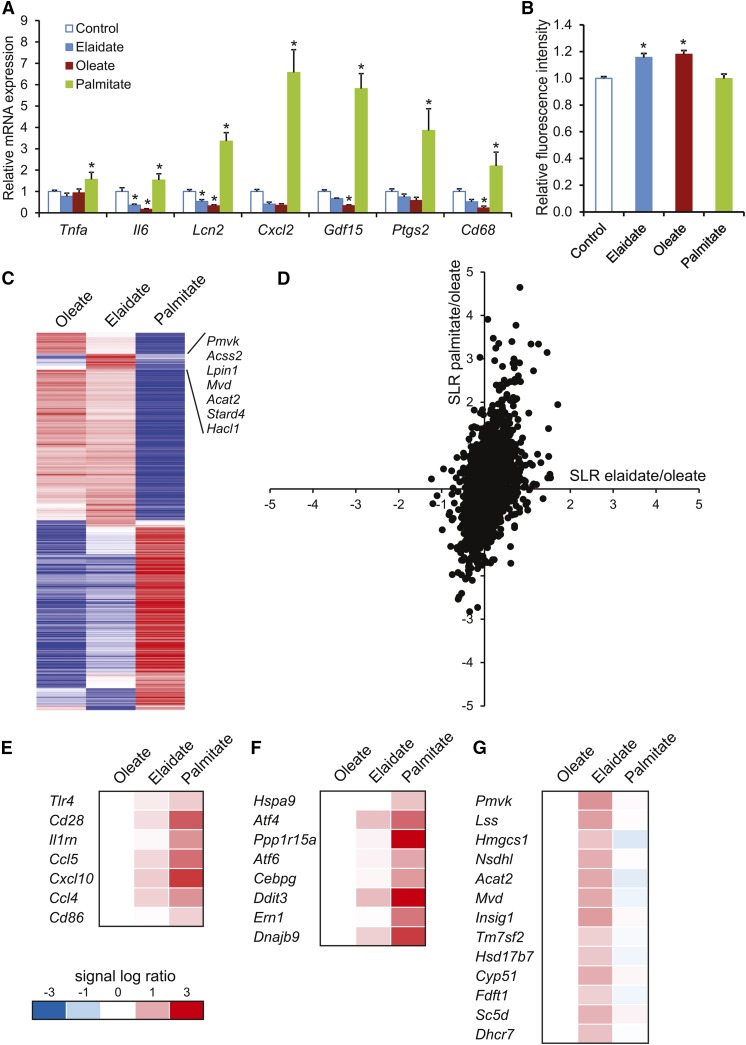
Differential gene expression profiles in macrophages treated with palmitate, oleate, or elaidate. A: Quantitative PCR expression of selected inflammatory markers in RAW264.7 cells after treatment with 500 μM FAs or vehicle control for 6 h. B: Fluorometric measurement of relative ROS as marker of oxidative stress in RAW264.7 macrophages. C: Heat map of the 500 most variable genes based on the calculation of the coefficient of variation. The cluster of genes deviating in the elaidate-treated cells is indicated. D: Scatter plot of genes that passed the UPC filter (7,905 of the 22,135 probe sets). The signal log ratio for the comparison of palmitate- versus oleate-treated cells is shown along the y-axis. The signal log ratio for the comparison of elaidate- versus oleate-treated cells is shown along the x-axis. E–G: Heat maps of pathways that were induced by palmitate: communication between innate and adaptive immune cells (E) and UPR (F), or elaidate: superpathway of cholesterol biosynthesis (G), according to Ingenuity pathway analysis. Asterisks indicate statistically significant relative to vehicle control (*P < 0.05).

