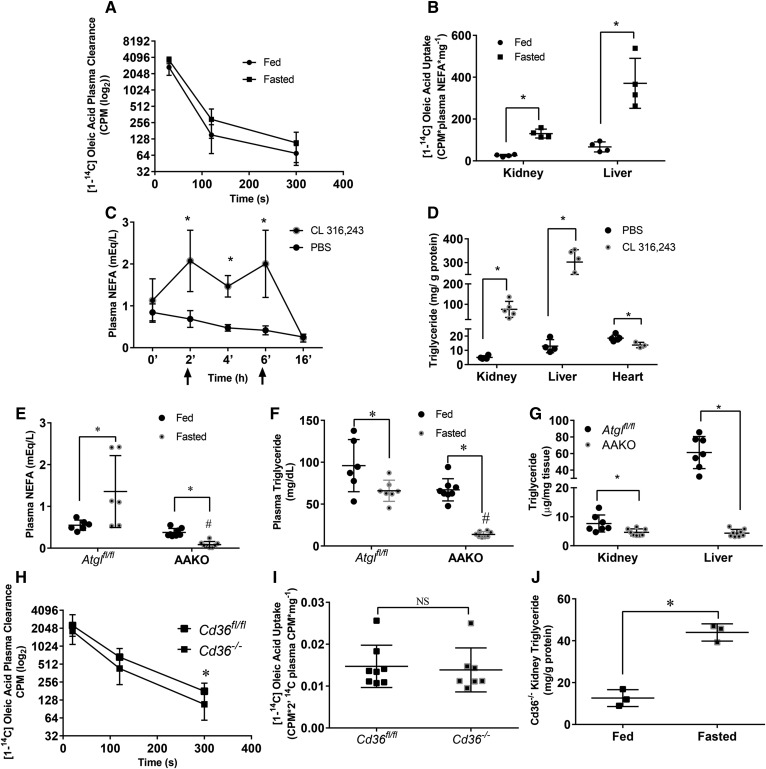
Fig. 4.
Plasma free fatty acids determine kidney triglyceride content and do not require CD36 for transport. A, B: [1-14C]oleic acid (OA) was injected intravenously into male mice. The presence of radioactive signal was measured in plasma or tissue homogenate using a LS 6500 multipurpose scintillation counter. A: Plasma clearance of [1-14C]OA over time. B: Liver and kidney 14C label 300s after injection. Experiments were performed in male mice, N = 4–5/group. C, D: Male mice were injected with CL 316,243 at 2 and 6 h time points, and blood samples were drawn at indicated points in order to measure NEFA concentration in the blood. Mice were euthanized at the 16 h time point to collect tissues, N = 4–5/group. C: Plasma NEFAs over time after two CL 316,243 injections (indicated by arrows). D: Tissue triglyceride content 16 h after first injection. E–G: Female adipocyte Atgl knockout mice (AAKO) or littermate controls were fasted for 16 h and eithanized, N = 6–8/group. Plasma NEFA (E) and triglyceride (F) of AAKO and control mice in the fed and 16 h fasted state. G: Kidney and liver triglyceride of AAKO and control mice after a 16 h fast. H–J: [1-14C]OA was injected intravenously into male mice. Presence of radioactive signal was measured in plasma or tissue homogenate as mentioned before. H: Plasma clearance of [1-14C]OA over time, N = 8–9/group. I: OA uptake in fasted Cd36fl/fl and Cd36−/− N = 8–9/group. Kidney lipids were extracted from kidneys of Cd36−/− in the fed and fasted state using 2:1 methanol:chloroform. J: Kidney triglyceride in fed and fasted Cd36−/−, N = 3/group.*P < 0.05, #P < 0.05. *Comparison between feeding status using unpaired Student’s t-test. #Comparison between genotype using the two-way ANOVA Tukey’s multiple comparison test. Results are presented as mean ± SD.

