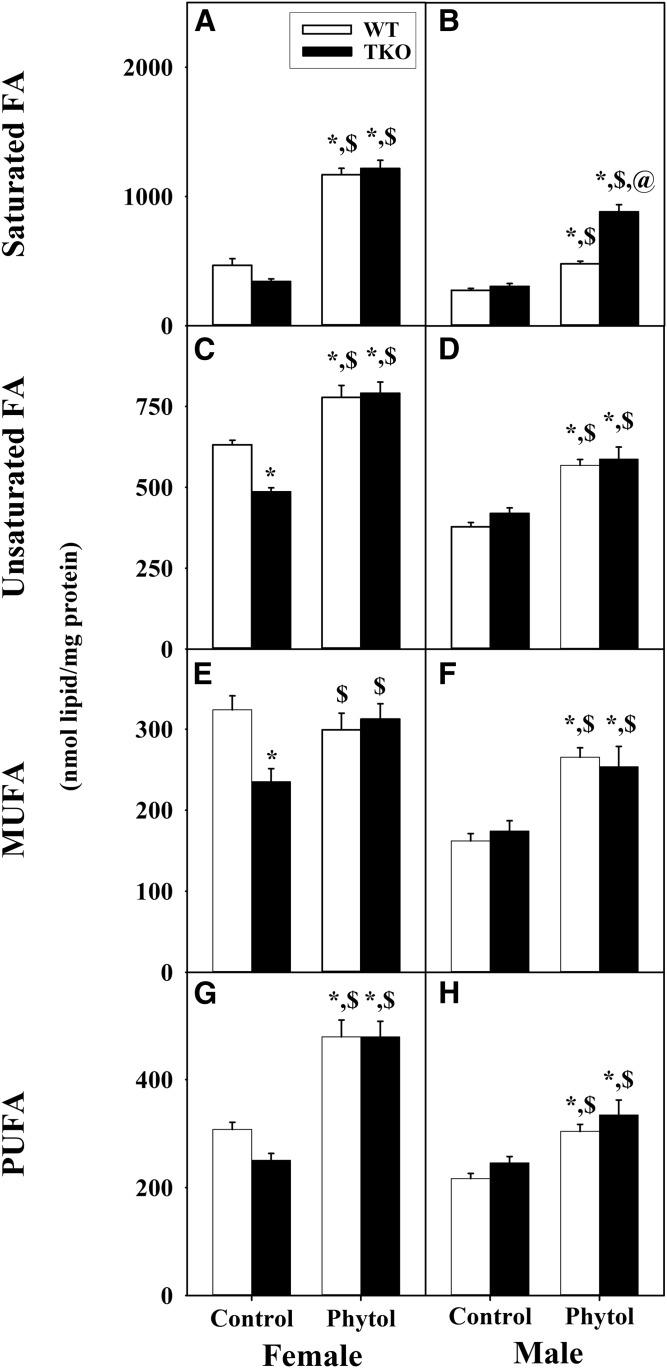
Fig. 5.
Mass distribution of fatty acid subgroups in livers of WT and TKO mice fed dietary phytol. Female (A, C, E, G) and male (B, D, F, H) WT (white bars) and Fabp1/Scp-2/Scp-x-null (TKO) (black bars) mice were fed control or 0.5% phytol-supplemented chow as described. Liver lipids were extracted and quantities (nanomoles per milligram of protein) of total hepatic saturated (Sat) fatty acids (A, B), unsaturated (Unsat) fatty acids (C, D), MUFAs (E, F), and PUFAs (G, H) determined by GC-MS as described in the Materials and Methods. Values represent the mean nanomoles of fatty acid per milligram of total liver protein ± SE (n = 4–6); *P ≤ 0.05 versus WT control-diet; $P ≤ 0.05 versus TKO control-diet; @P ≤ 0.05 versus WT phytol-diet.

