Fig. 4.
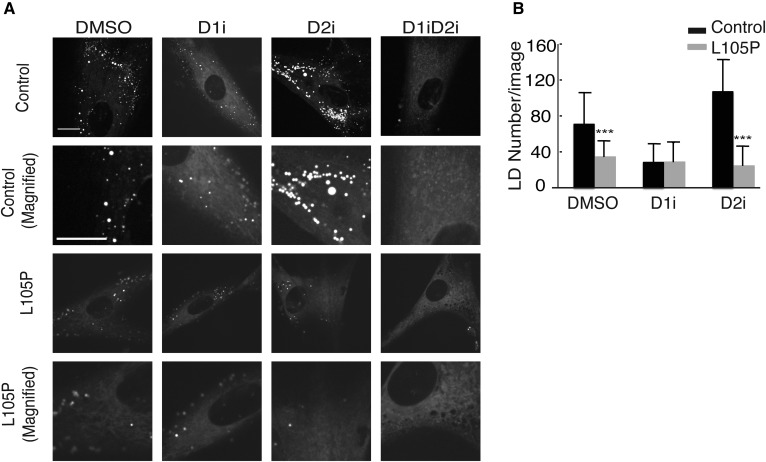
A: Mutant fibroblasts have fewer lipid droplets (LD) under DMSO and DGAT2 inhibitor (D2i) conditions after oleate treatment. Cells were stained with BODIPY 493/503 and imaged for neutral lipids. Representative images are shown. Scale bar: 30 μm. B: Lipid droplet numbers were quantified using CellProfiler. Quantification represents data from six to eight images per cell line (three controls and two patients) per condition. Statistical significance was determined by Wilcoxon rank sum test; ***P < 0.0001. D1i, DGAT1 inhibitor, D1iD2i, DGAT1 and DGAT2 inhibitors.

