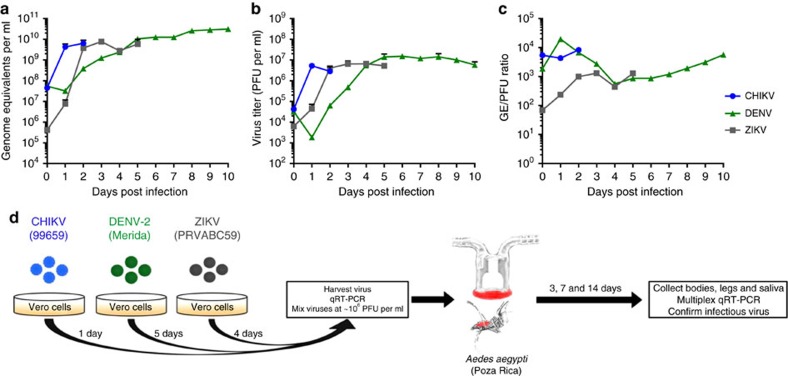
Figure 2. Virus replication kinetics and experimental design.
Virus growth curves were used to determine GE per ml (a), PFU per ml (b) and GE/PFU ratio (c) after infection of Vero cells with CHIKV (blue), DENV-2 (black) and ZIKV (green). Arrows indicate the time points used to collect fresh virus stocks for bloodmeals. Data points represent the mean of five biological replicates; error bars represent s.d. The experimental design of mosquito infections/coinfections is shown in d.

