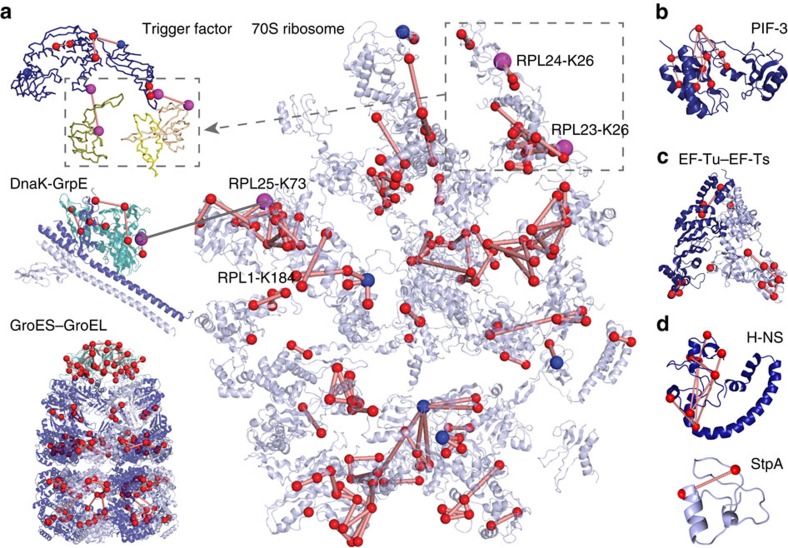
Figure 3. Cross-link mapping on representative protein complexes of E. coli.
Cross-links shown as red lines could be mapped within one high-resolution structure. These cross-link are within the expected distance range of the DSSO cross-linker (general Cα–Cα distance range: 7–25 Å, see Supplementary Discussion for additional information on the ribosomal cross-links). Lys residues that are cross-linked within a single high-resolution structure are shown as red spheres; Lys residues that are involved in cross-links between two high-resolution structures are shown as purple spheres; Lys residues that exhibit cross-links indicating polysome formation are shown as blue spheres. (a) Architecture of chaperone–ribosome co-assemblies (top-left: TF (PDB: 2VRH); middle-left: DnaK-GrpE complex (PDB: 1DKG); bottom-left: GroES-GroEL (PDB: 1PCQ); right: 70S ribosome (PDB: 3JCD)). (b) Cross-links mapped onto a homology model of prokaryotic translation initiation factor 3. (c) Cross-links confirm the crystal structure of the elongation factor Tu and elongation factor Ts complex (PDB entry 4PC1). (d) Cross-links within the bacterial DNA remodeler and transcriptional regulator H-NS (homology model) and its paralogue StpA (PDB entry 2LRX).

