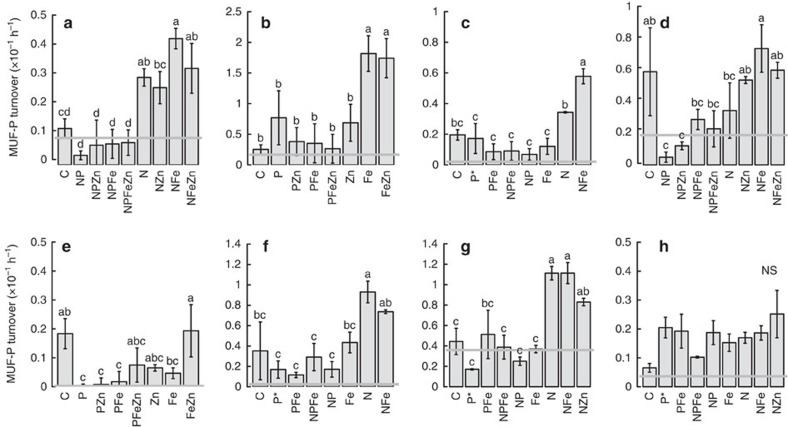
Figure 4. Alkaline phosphatase activity responses to nutrient additions.
(a–h) Experiments 1–8. Activities are shown as turnover rates of the spiked DOP substrate, 4-methylumbelliferyl phosphate (MUF-P). Shown are means±s.e.'s, n=3 for all except where indicated by an asterisk (n=2). The grey horizontal line is the mean initial time point measurement (n=3). Treatment means were compared using a one-way ANOVA and a Fisher PLSD means comparison test (indistinguishable means labelled with the same letter (P<0.05); NS is ‘not significant').

