. 2016 Jul 19;3(2):e7. doi: 10.2196/rehab.4340
©Amit Pande, Prasant Mohapatra, Alina Nicorici, Jay J Han. Originally published in JMIR Rehabilitation and Assistive Technology (http://rehab.jmir.org), 19.07.2016.
This is an open-access article distributed under the terms of the Creative Commons Attribution License (http://creativecommons.org/licenses/by/2.0/), which permits unrestricted use, distribution, and reproduction in any medium, provided the original work, first published in JMIR Rehabilitation and Assistive Technology, is properly cited. The complete bibliographic information, a link to the original publication on http://rehab.jmir.org/, as well as this copyright and license information must be included.
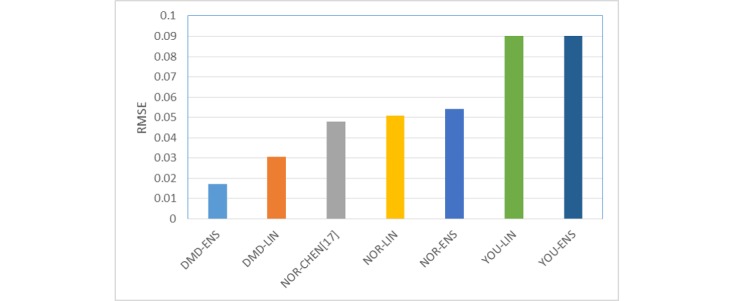
Figure 4.

Bar chart showing root mean square error obtained using different models.
