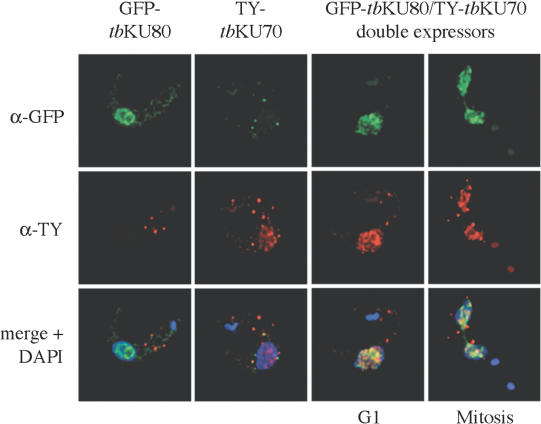
Figure 1.
Expression pattern and co-localization of tbKU80 and tbKU70. Deconvolution of single-focal-plane images of bloodstream forms. Indirect IF shows distribution of GFP–tbKU80 (green fluorescence), TY–tbKU70 (red fluorescence) and DAPI-stained nuclei (blue fluorescence). The two left panels show the distribution of tbKU80 and tbKU70 separately in the nucleus of two bloodstream-form cell lines. The two right panels show co-localization of tbKU80 and tbKU70 (merge, yellow fluorescence) in one representative trypanosome of ‘double expressors’ cell line in G1 and one trypanosome during late mitosis.

