
Figure 1.
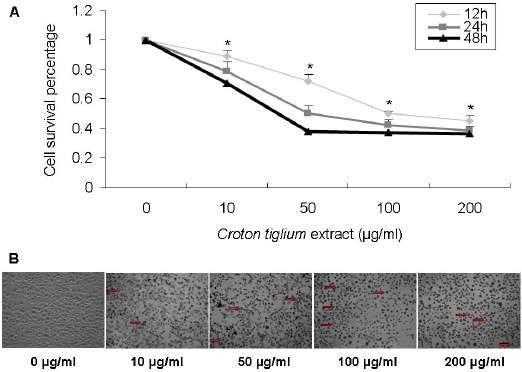
Effect of Croton Tiglium Extract on the Proliferation of A549 Cells.
(A) Cell proliferation and viability were determined by an MTT assay. Cell viability was observed with Croton tiglium extract at various concentrations (10, 50, 100 and 200 μg/ml) for 12, 24 and 48 h. Data are presented as means ± standard deviation (n=3, triplicate). *: P<0.05 compared with control (0 μg/ml and 0 h).
(B) The morphological changes of A549 cells with Croton tiglium extract after 24 h. Cell viability was observed with Croton tiglium extract treatment at various concentrations (10, 50, 100 and 200 μg/ml) for 24 h under the inverted microscope (×100)