Figure 2.

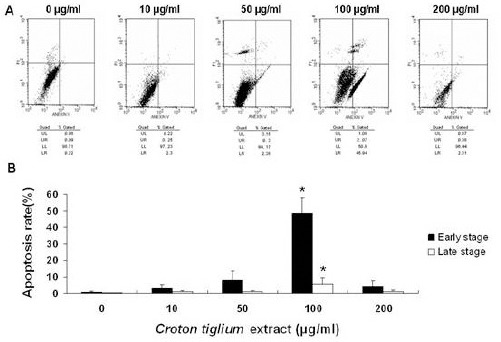
Croton Tiglium Extract Induces Apoptosis in A549 Cells.
(A) A549 cells treated with various concentrations of Croton tiglium extract were double-stained with annexin V and propidium iodide and analyzed by flow cytometry. The gate setting distinguished between living [lower left (LL)], necrotic [upper left (UL)], early apoptotic [lower right (LR)] and late apoptotic [upper right (UR)] cells. The representative data was shown from three separate assays.
(B) Quantitative data indicated that increasing the Croton tiglium extract concentration led to dose-dependent apoptosis in A549 cells. Data are presented as means ± standard deviation (n=3, triplicate). *: P<0.05 compared with control (0 μg/ml)
