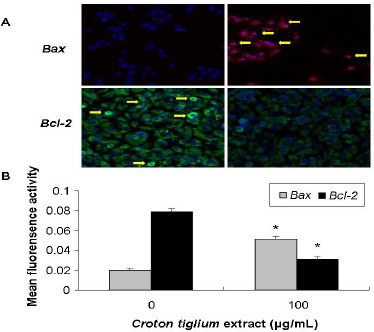
Figure 4.

Immunostaining for Apoptosis-Related Protein in A549 Cells Treated with Croton Tiglium Extract.
(A) Representative immunofluorescence staining photomicrographs of Bax and Bcl-2 in A549 cells with 0 or 100 μg/ml Croton tiglium extract for 24 h, visualized by confocal microscope (×200).
(B) Mean fluorescence activity of Bax and Bcl-2 expressions in A549 cells analyzed by image-pro plus 6.0 software. *: P<0.05 compared with control (0 μg/ml).
