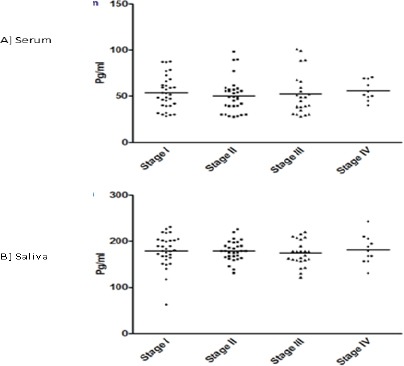
Figure 4.

A and B: IL-6 Levels Based on Clinical Staging in OSCC.
The levels of IL-6 compared in serum (A) and saliva (B) of OSCC subjects based on clinical staging. Each dot represents IL-6 level of each individual subject and the horizontal line represent mean value
