
Figure 1.
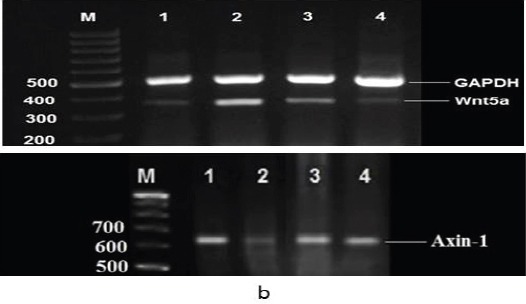
Agarose Gel Electrophoresis Showing (a): Wnt5a and (b): Axin-1 mRNA expression in the colon tissue by RT-PCR analysis. GAPDH expression with 496 bp, Wnt5a expression with 324 bp and Axin-1 expression with 658 bp. Lane (1): represents negative control group and lane (2): represents colon cancer bearing group. Lane (3): represents colon cancer + quercetin group, whereas lane (4) represents colon cancer + 5-FU group. Lane M: represents DNA ladder (100 bp).