Figure 1.
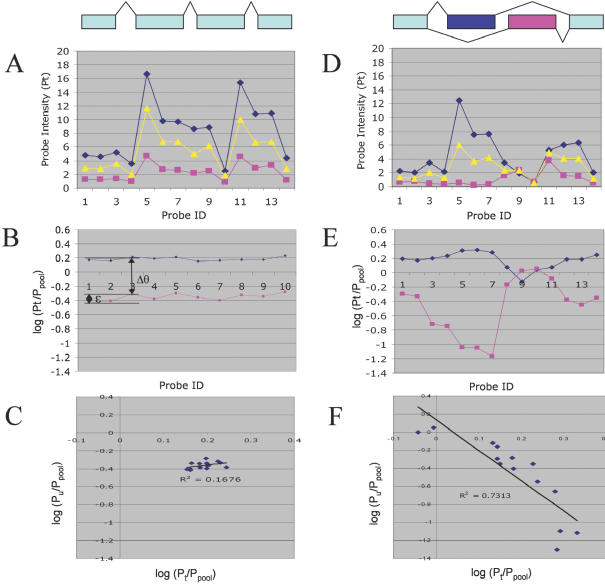
Distinguishing changes in splicing from changes in total gene expression. Simulated data for multiple probes in a single gene, for two tissues (blue, pink) versus a pooled sample (yellow) representing their average, in the absence (A–C) or presence (D–F) of alternative splicing. (A) In the absence of alternative splicing, the probe intensities for different probes in a gene should show a similar profile in different tissues, reflecting the specific probe sensitivities. (B) Taking the log-ratio of each probe intensity versus its intensity for the pooled sample eliminates the effect of probe sensitivity differences, leaving only the difference in total expression (Δθ) and random probe variation (ɛ). (C) A scatterplot of each probe's log-ratio (versus pool) for tissue t versus tissue u yields a random scatter, whose position reveals their difference in total expression. (D) The introduction of alternative splicing can cause the profiles of the two tissues to differ significantly. (E) Because the pool (yellow in D) is always intermediate between the two tissues, taking the log-ratio versus pool tends to reveal alternative splicing as a ‘mirror image’ pattern. When the proportion of a splice form increases in tissue t relative to tissue u, for probes that are preferentially sensitive to that form (σ > 1), the log-ratio for tissue t will increase, while the log-ratio for tissue u will decrease, and vice versa. (F) This gives rise to a clear pattern of anti-correlation in the scatterplot of the log-ratios.

