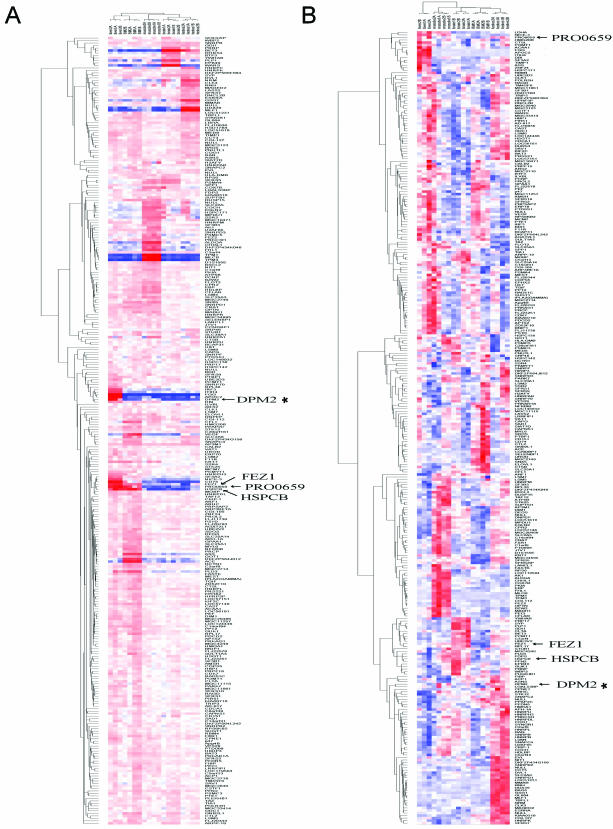
Figure 4.
Hierarchical clustering of alternative splicing for five human tissues. (A) For each array, we computed its mean correlation coefficient r versus arrays from other tissues (see Materials and Methods), and displayed the results using dChip (r = −1, red, representing a divergent splicing pattern; r = +1, blue, representing a consensus splicing pattern) with hierarchical clustering on both the array samples and genes. The simplest tissue-specific alternative splicing examples partition into just two distinct splicing patterns (red versus blue), but more complex alternative splicing patterns are revealed mainly by regions of anti-correlation (red), due to the limitations of this color mapping representation (see Materials and Methods). (B) Gene expression clustering of the same microarray data, using dChip's hierarchical clustering of expression values for each gene, clustering both the samples and genes (see Materials and Methods) (see Supplementary Material for high resolution image).

