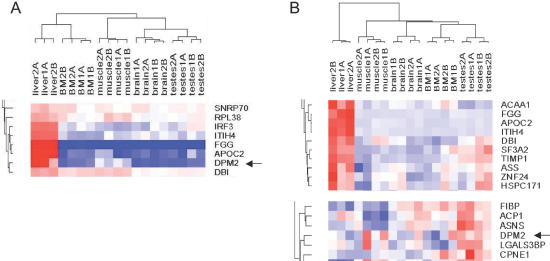
Figure 5.
Comparison of alternative splicing clusters versus gene expression clusters. (A) A detailed view of the alternative splicing clusters, showing a cluster of genes with liver-specific alternative splicing. (B) A detailed view of the gene expression clustering, showing the cluster of genes that are up-regulated specifically in liver (above), and the separate cluster containing DPM2 (below).

