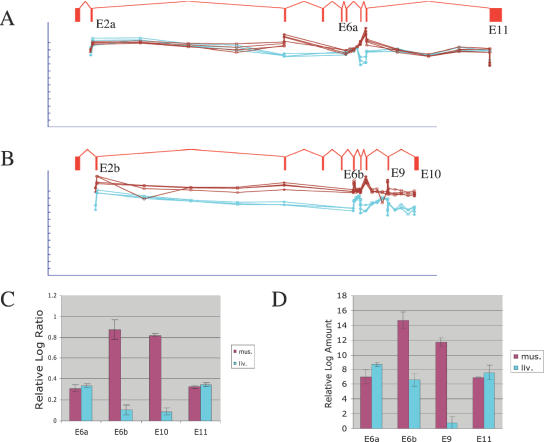
Figure 6.
Detection of mutually exclusive exons and alternative termination in TPM1. (A) Raw microarray probe intensities for exons and splice junctions contained in a non-muscle splice form of TPM1, for four replicate arrays for muscle (brown) and three replicate arrays for liver (cyan). Each probe is shown immediately beneath the exon or splice junction it matches; the gene structure for a non-muscle transcript inferred from ESTs is shown. Three alternative splicing events are indicated: mutually exclusive exons 2a versus 2b; mutually exclusive exons 6a versus 6b; and alternative termination (exon 11 versus exons 9 and 10). Probe intensity is shown on a log scale; the tick marks represent 2-fold steps. The fact the plots closely overlap indicates that this isoform is expressed at the same level in both tissues. Only the constitutive exons (3, 7 and 8) included in the muscle-specific isoform shown in (B) show up-regulation. (B) Raw microarray probe intensities for exons and splice junctions contained in a muscle-specific splice form of TPM1, displayed as in (A). All the probes for this isoform had stronger fluorescent intensity in muscle, although there are variations in probe sensitivity. (C) Mean log-ratio values for exon probes in exons 6a, 6b, 10 and 11, measured from the muscle or liver microarray experiments. (D) Mean log amount values measured in independent real-time PCR experiments amplifying exons 6a, 6b, 9 and 11, derived from the Ct value (see Materials and Methods).

