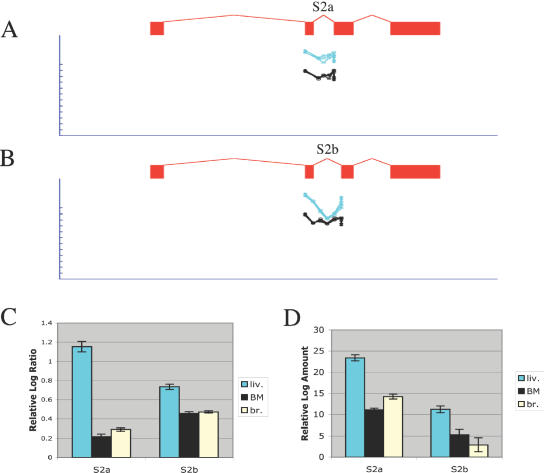
Figure 8.
Detection of alternative 3′ splicing in APOC2. (A) Raw microarray probe intensities for the first splice junction (S2a) between exons 2 and 3, for three replicate arrays for liver (cyan) and four replicate arrays for bone marrow (black). Each probe is shown immediately beneath the exon or splice junction it matches; the gene structure for a muscle-specific transcript inferred from ESTs is shown. Probe intensity is shown on a log-scale; the tick marks represent 2-fold steps. (B) Raw microarray probe intensities for the second splice junction (S2b) between exons 2 and 3. (C) Mean log-ratio values for splice probes for S2a and S2b, measured from the liver, bone marrow or brain microarray experiments. (D) Mean log amount values measured in independent real-time PCR experiments amplifying splice forms S2a and S2b, derived from the Ct value (see Materials and Methods).

