
Figure 1.
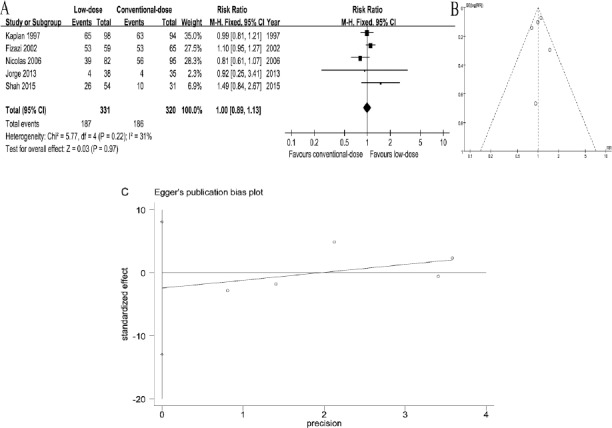
Forest Plots of Associations between Low-Dose Arm and Conventional-Dose Arm and Funnel Plot of RCTs. A, relative risks for overall response rate. B, funnel plot of RCTs. C, Visual assessment of publication bias on egger test
Official websites use .gov
A
.gov website belongs to an official
government organization in the United States.
Secure .gov websites use HTTPS
A lock (
) or https:// means you've safely
connected to the .gov website. Share sensitive
information only on official, secure websites.
Forest Plots of Associations between Low-Dose Arm and Conventional-Dose Arm and Funnel Plot of RCTs. A, relative risks for overall response rate. B, funnel plot of RCTs. C, Visual assessment of publication bias on egger test