
Fig. 5.
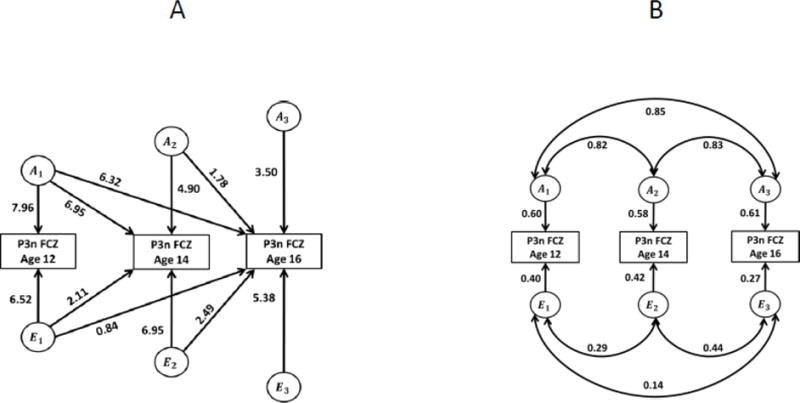
Path diagrams for structural equation models, No-Go P3 amplitude. A. Cholesky (triangular decomposition) model. Rectangles are observed (measured) ERP phenotypes, circles are latent factors (A, additive genetic; E, non-shared environmental). Arrows show causal paths from latent factors to phenotypes. Note that the paths from genetic factors at age 12 lead to the phenotype at all three ages, allowing for the possibility of genetic overlap across ages (i.e. continuity of genetic influences). Additional paths at ages 14 and 16 allow for the possibility of age-specific genetic influences (i.e. new genetic influences emerging in the course of development). Paths from the environmental factors have similar interpretation. B. Standardized solution showing proportions of variance attributable to genetic and environmental factors at each age, and the genetic and environmental correlations. Same models for other ERP phenotypes (N2 and Go P3) are presented in Supplementary Material.