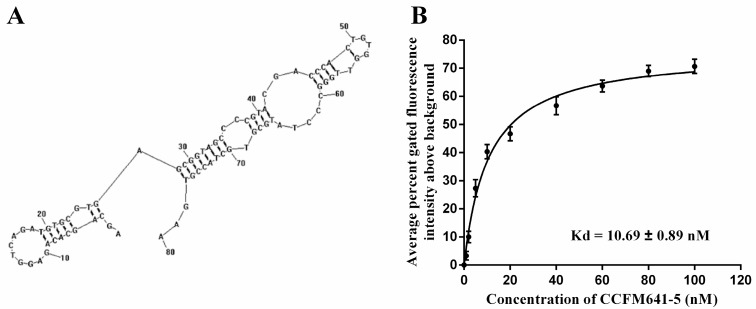
Figure 2.
The secondary structure and binding ability of aptamer CCFM641-5 against B. bifidum. (A) The secondary structure of aptamer CCFM641-5. The secondary structure was predicted using RNAstructure 3.0. (B) The binding saturation curve of aptamer CCFM641-5 with B. bifidum. A nonlinear regression curve was fit according to the data from flow cytometric analysis using GraphPad Prism 5.0. The values of aptamer binding and Kd represent the mean ± SD of three independent experiments.

