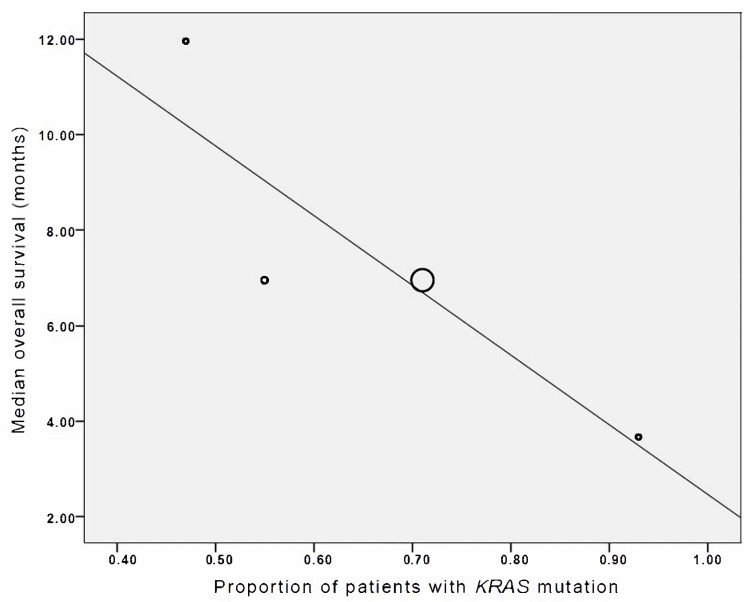
Figure 4.
Individual study association of proportion of patients with KRAS mutations and median overall survival (in months). Each study is represented by a circle, and the area of the circle is proportional to the number of patients enrolled in each study. The gradient of the line represents the results of the meta-regression (R = −0.88).

