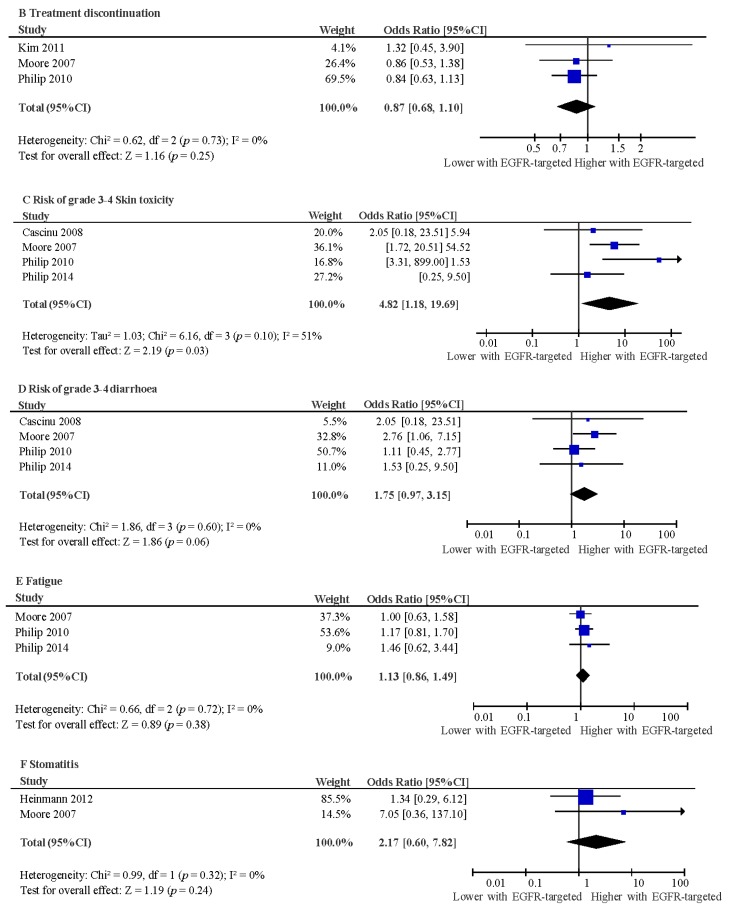
Figure 5.
Forest plots showing odds ratio for toxic death (A); treatment discontinuation (B); risk of grade 3–4 skin toxicity (C); risk of grade 3–4 diarrhoea (D); fatigue (E) and stomatitis (F) for addition of EGFR-targeted treatment to chemotherapy versus control. Experimental arm: EGFR-targeted therapy + chemotherapy; Control: chemotherapy; CI: confidence interval.


