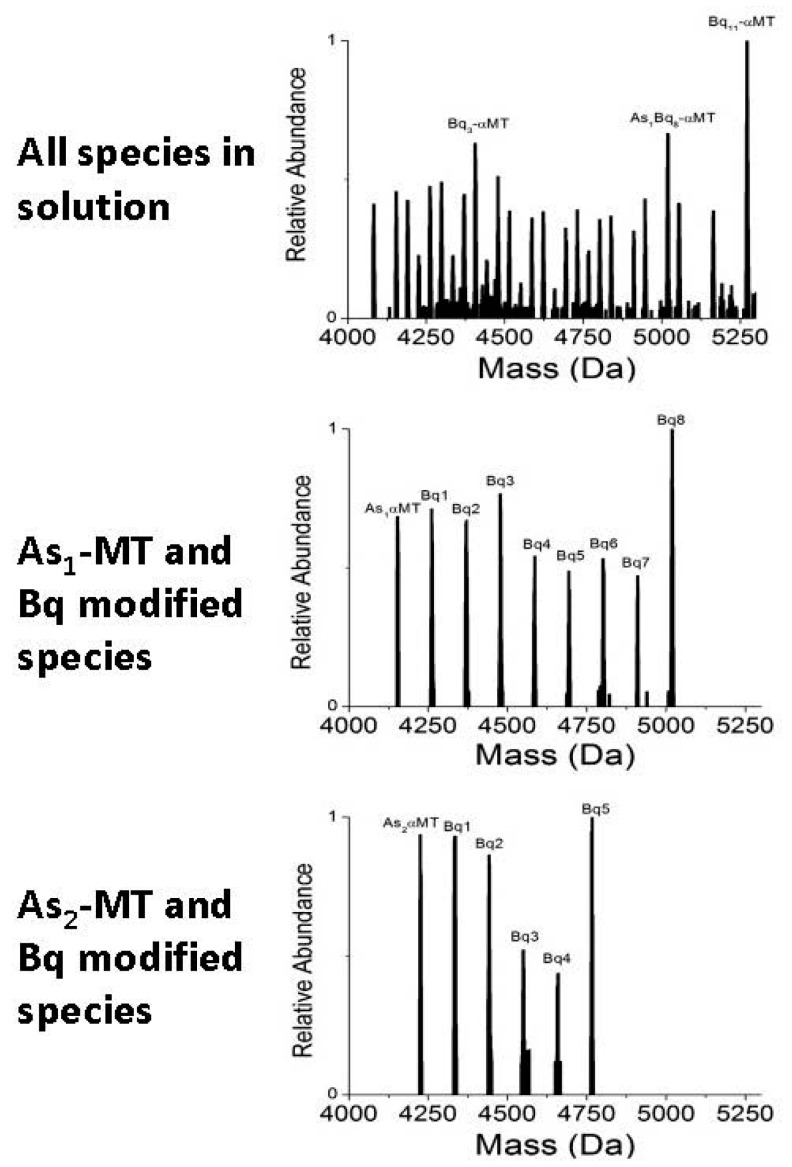
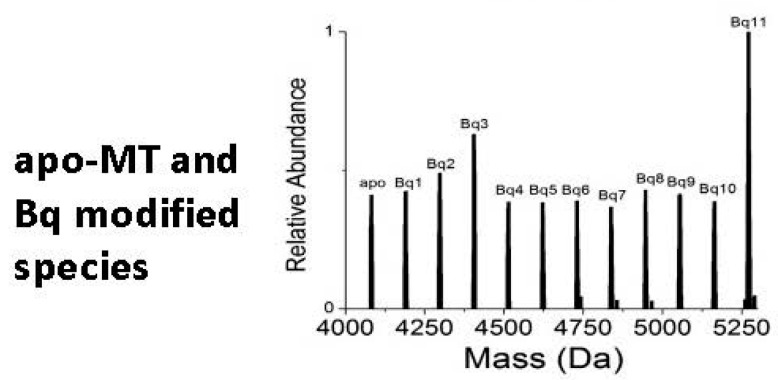
Figure 5.
Modification of apo-As1 and As3-αMT solution with p-benzoquinone (Bq). The original spectra after modification is shown at the top. The individual species and their modifications are isolated from the top spectra and are shown below in the left column. Adapted with permission from Irvine et al., 2013 [44].


