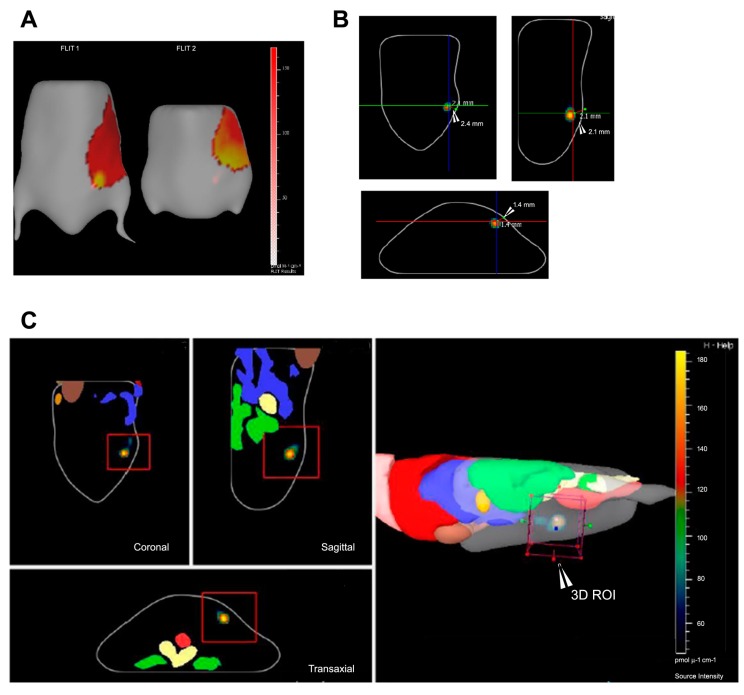
Figure 4.
2D vs. 3D imaging of NIRF probe in mouse xenograft. (A) 2D planer image showing NIRF signal at source (tumor); (B) 3D coronal, sagittal, and transaxial image views with slice plane optimization, showing the center of mass of the tumor from the surface of the body; (C) Corresponding coronal, sagittal, and transaxial image views with the 3D region of interest (ROI) marked on reconstructed mouse image with overlapping organ atlas.

