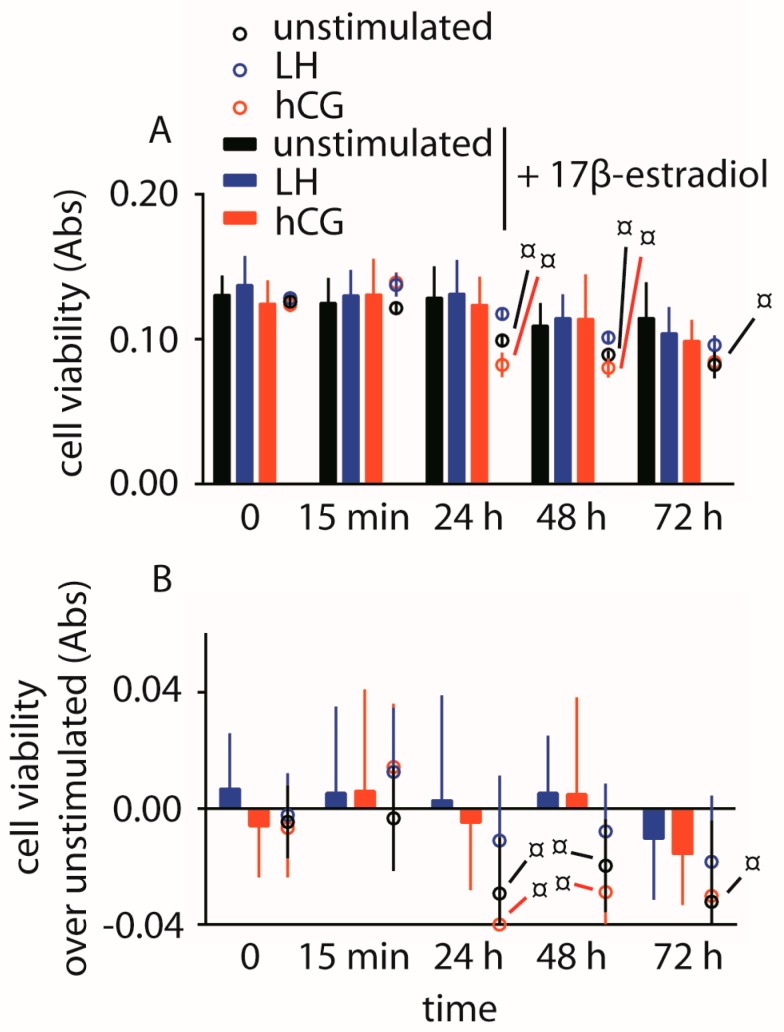
Figure 6.
Analysis of hGLC viability by the MTT assay. Cells were maintained under LH or hCG treatment in the presence of 17β-estradiol. Cells maintained in the absence of gonadotropin served as controls. Data from samples maintained in the presence of 17β-estradiol are represented by bars, while circles were samples in the absence of the estrogens extracted from Figure 1 and Figure 2. (A) Directly measured absorbance values; (B) Cell viability values expressed as increase or decrease over basal levels. ¤ = significantly different versus same gonadotropin stimulation, at the same time-point; (two-way ANOVA and Bonferroni post-test; p < 0.05; means ± SD; n = 10).

