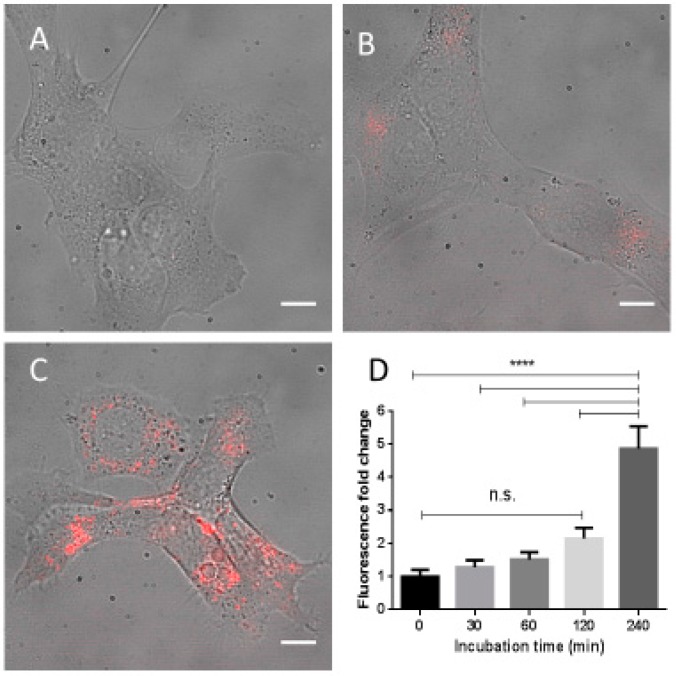
Figure 2.
Human hepatocarcinoma (HepG2) cells incubated with 90 μg/mL Fe3O4-nanoparticles conjugated with fluorescent dye Dylight650. The images of treated cells at selected incubation times are shown: 0 min (A); 120 min (B); and 240 min (C). The increments in fluorescence intensity at each incubation times, mean ± standard error (SE), are reported in the insert (D). Scale bar: 10 µm; **** p < 0.0001; n.s. = not significant.

