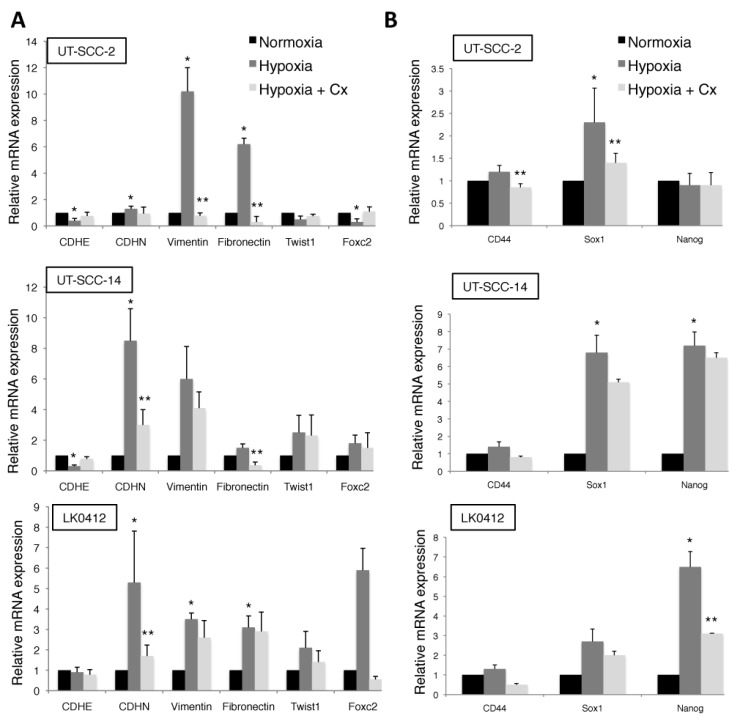
Figure 2.
Hypoxia-induced epithelial-mesenchymal transition (EMT) and expression of stem cell markers in HNSCC. RT-qPCR was performed to analyze mRNA expression levels of EMT (A) and stem cell (B) markers in HNSCC cells following exposure to normoxic and hypoxic conditions for 7 days in the presence or absence of cetuximab (60 nM). The relative amount of analyzed genes is calculated using the 2−ΔΔCt method and amplification of GAPDH and β-actin were used as an internal standard. Data were normalized to cells cultured in normoxic conditions in each column graph (mean values ± SD; n = 3). * p < 0.05 versus N (normoxia) and ** p < 0.05 versus H (hypoxia) according to Student’s t-test.

