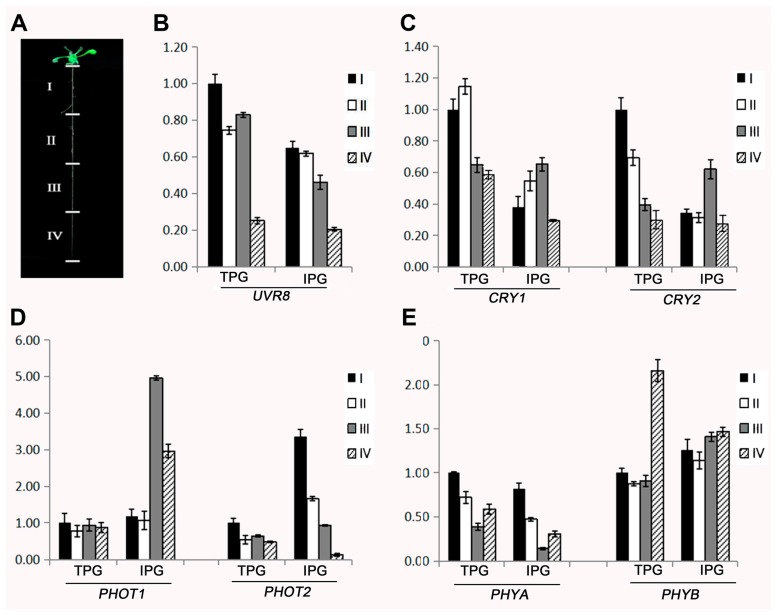
Figure 4.
Expression patterns of seven plant photoreceptors in Arabidopsis roots grown in TPG and IPG conditions. (A) An image showing four sections from the roots of Arabidopsis with 1.5 cm length for each section. (B–E) Total RNAs were extracted from each section and qRT-PCR was used to quantify the relative expression level of target genes. The expression levels of each gene in Section I of TPG roots were set as 1. The relative expression of all of these genes was presented. The expression of UVR 8 is (B), CRY1 and CRY2 is (C), PHOT1 and PHOT2 is (D), and PHYA and PHYB is (E).

