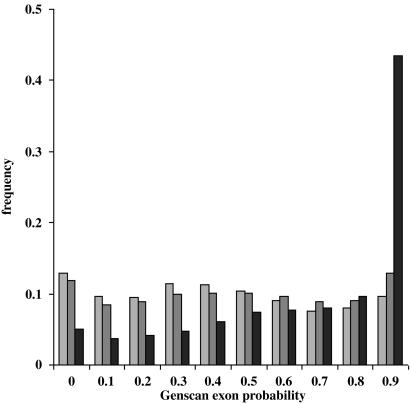
Fig. 3.
The distribution of genscan exon probabilities for predicted genes within D. melanogaster intergenic regions closely approximates that of random sequence. Distribution of exon probabilities assigned by genscan to predictions lying within 2 Mb of random sequence 0.25 G:A:T:C (light gray bars), 62 Mb of D. melanogaster release 3.1 intergenic regions (gray bars), and the first 2 Mb of the D. melanogaster chromosome arm 2L (black bars).

