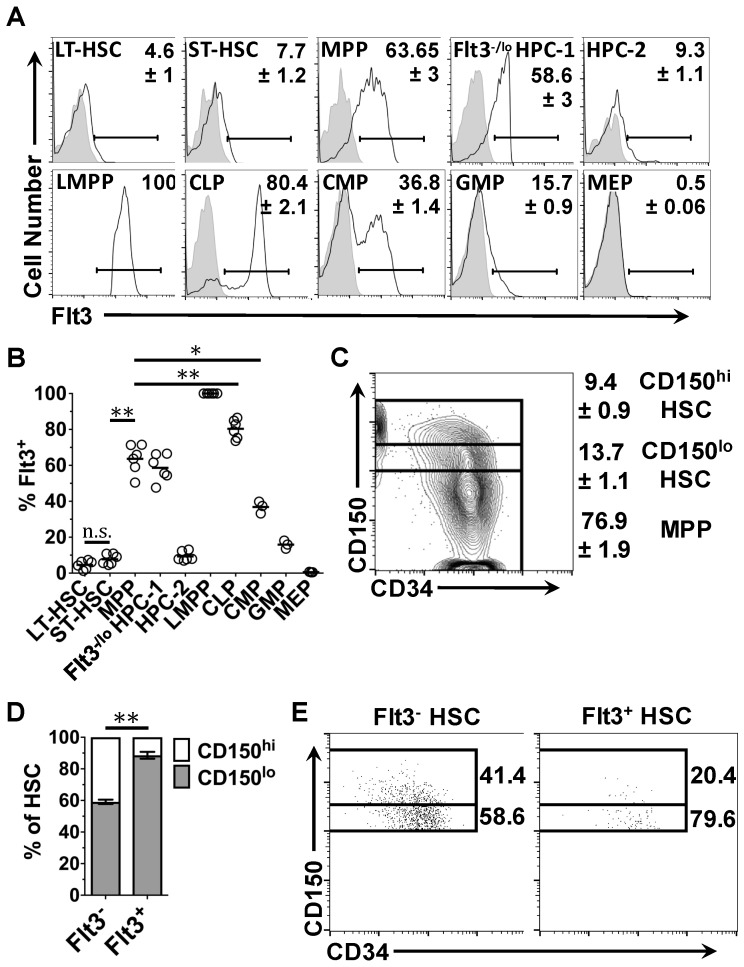
Figure 3.
Cell surface expression of Flt3 protein by HSPC: (A) the gating strategy used to detect Flt3 on the surface of HSC and HPC populations (solid black line), compared to an isotype control (shaded histogram); (B) the percentage of cells within each HSPC compartment that expressed Flt3 protein at their surface; (C) the gating strategy used to identify LSK CD48− cells with high (CD150hi) and low levels of CD150 (CD150lo) expressed at their surface and those lacking CD150 expression (MPP); (D) the percentages of Flt3+ and Flt3− cells within the HSC compartment that express low and high levels of CD150 on their surface; and (E) the gating strategy in (C) applied to cells within the Flt3+ and Flt3− HSC populations in a representative sample. Data in (A,B) and (C,D) are the mean of the values obtained from n = 3–6 and n = 6 mice, respectively. Values depicted in (A,C,E) represent the percentage of cells within each gate. Solid arrows in (A,C,E) indicate increasing cell number or the signal intensity in the designated channel. p values obtained by two-tailed non-parametric Student’s t-test, where ** p < 0.005. HSC, hematopoietic stem cell; LT-HSC, long-term reconstituting hematopoietic stem cell; ST-HSC, short-term reconstituting hematopoietic stem cell; MPP, multipotent progenitor; HPC, hematopoietic progenitor cell; LMPP, lymphoid-primed multipotent progenitor; CLP, common lymphoid progenitor; CMP, common myeloid progenitor; GMP, granulocyte-monocyte progenitor; MEP, megakaryocyte-erythrocyte progenitor; Flt3, fms-like tyrosine kinase 3; LSK, Lineage marker− Sca1+ c-Kit+.

