Figure 5.
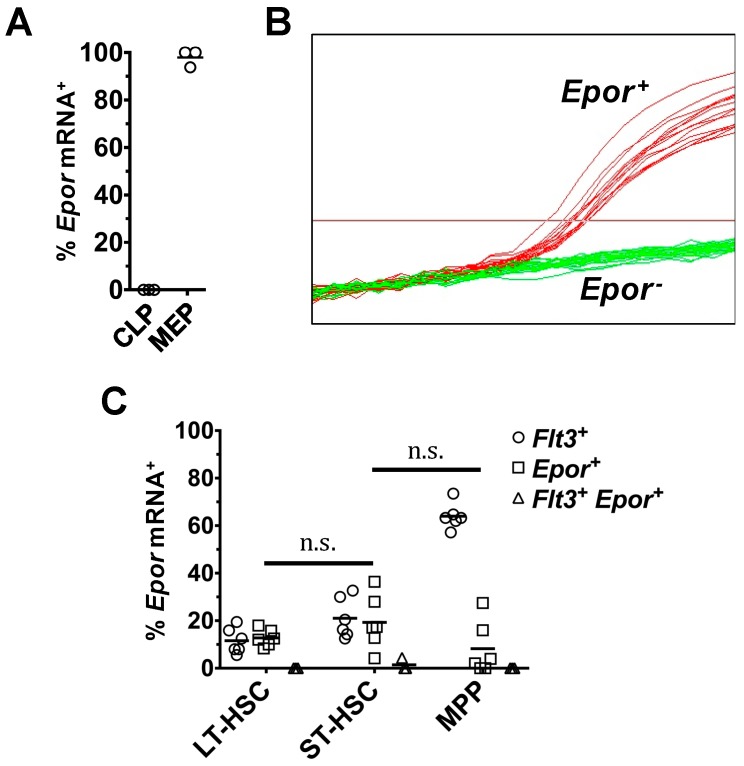
Flt3 and Epor transcripts are rarely co-expressed by LT-HSC, ST-HSC and MPP. Analysis of Flt3 and Epor co-expression by LT-HSC, ST-HSC and MPP was carried out using a triplex qRT-PCR assay specific for Actb, Flt3, and Epor mRNA. Reactions that did not give rise to a detectable amplification of Actb were removed from analysis. (A) The percentage of CLP and MEP that expressed Epor mRNA; (B) the amplification of Epor mRNA in single ST-HSC where there is a clear distinction between cells that expressed the Epor (shown in red) and those that did not (shown in green); and (C) the percentage of LT-HSC, ST-HSC and MPP that co-expressed both Flt3 and Epor mRNA. The total fraction of Flt3mRNA+ and EpormRNA+ are also shown. Data in (A) are the mean of the values obtained from n = 3 mice. Data in (C) are the mean of the values obtained from n = 3–6 mice. p values obtained by two-tailed non-parametric Student’s t-test, where n.s., non-significant. LT-HSC, long-term reconstituting hematopoietic stem cell; ST-HSC, short-term reconstituting hematopoietic stem cell; MPP, multipotent progenitor; MEP, megakaryocyte-erythrocyte progenitor; CLP, common lymphoid progenitor; Flt3, fms-like tyrosine kinase 3; Epor, erythropoietin receptor.

