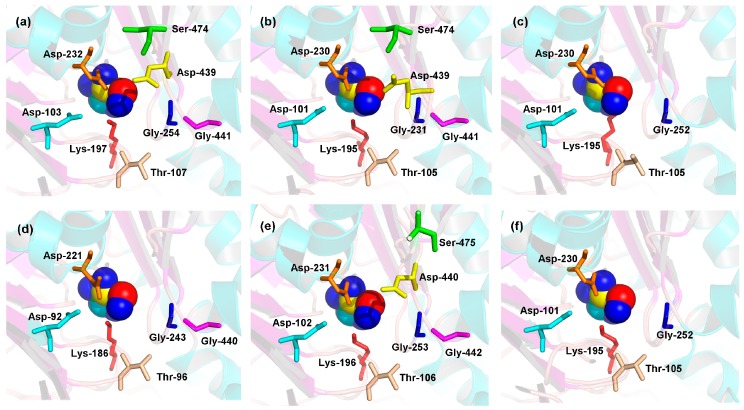
Figure 8.
Distribution of the residues in the enzyme active sites of MeHXK1–6. (a) MeHXK1; (b) MeHXK2; (c) MeHXK3; (d) MeHXK4; (e) MeHXK5; and (f) MeHXK6. Spherical structures indicate glucose molecules and the colored stick structures represent the catalytic residues. The image was generated using the PyMOL program.

