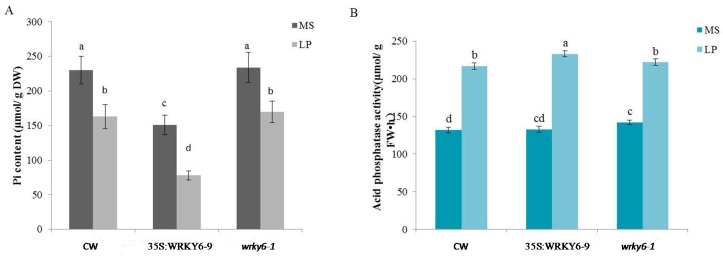
Figure 1.
Measurements of Pi content and acid phosphatase activity in three plant samples. Note: (A) measurements of Pi content; (B) measurements of acid phosphatase activity. Values followed by different lowercase letters mean that data was significantly different among samples in the same treatment at 0.05 level. Bars represent the mean ± SE (n = 5).

