Figure 6.
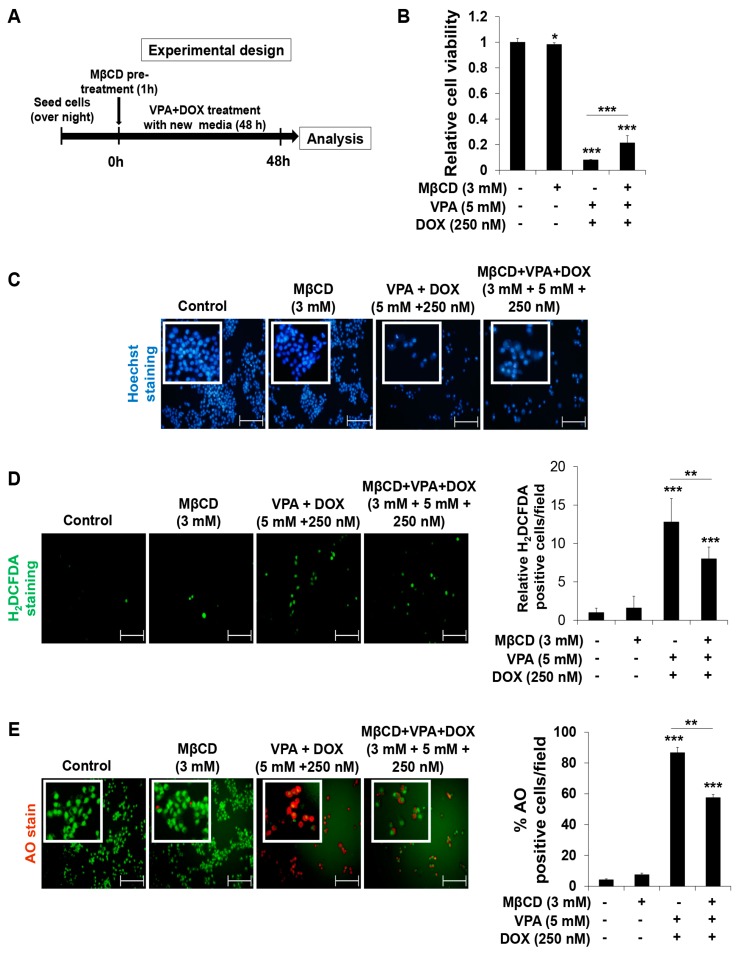
Pre-treatment of MβCD significantly recovers the effect of VPA and DOX combination treatment in HepG2 cells. (A) The experimental design of MβCD pre-treatment with or without VPA-DOX combined treatment in HepG2 cells; (B) the viability of HepG2 cells was determined at the indicated experimental condition by using EZ-Cytox assay; (C) Hoechst nuclear staining was used to detect apoptosis with condensed and fragmented nucleus in HepG2 cells at the indicated experimental condition. Images were taken using fluorescence inverted microscope. Scale bar represents 200 μm; (D) The 2′,7′-dichlorofluorescein diacetate (H2DCFDA) fluorescence probe was used to determine ROS generation in HepG2 cells at the indicated experimental condition. Images were taken using fluorescence inverted microscope. Scale bar represents 200 μm. The ROS-generating cells were counted in different fields (containing at least 40 cells per field) and calculated relative to the control group for each experimental condition (right panel); (E) Acridine orange (AO) staining was used to detect acidic vesicles in HepG2 cells at the indicated experimental condition. Images were taken using fluorescence inverted microscope. Red color represents acidic vesicle and green color represents non-acidic vesicle. Scale bar represents 200 μm. Percentages (%) of AO-positive cells were counted in different fields (containing at least 40 cells per field) (right panel). Three independent experiments were performed and results reported as the mean ± standard deviation (SD). * p < 0.05, ** p < 0.01, *** p < 0.001 compared with the control group.

