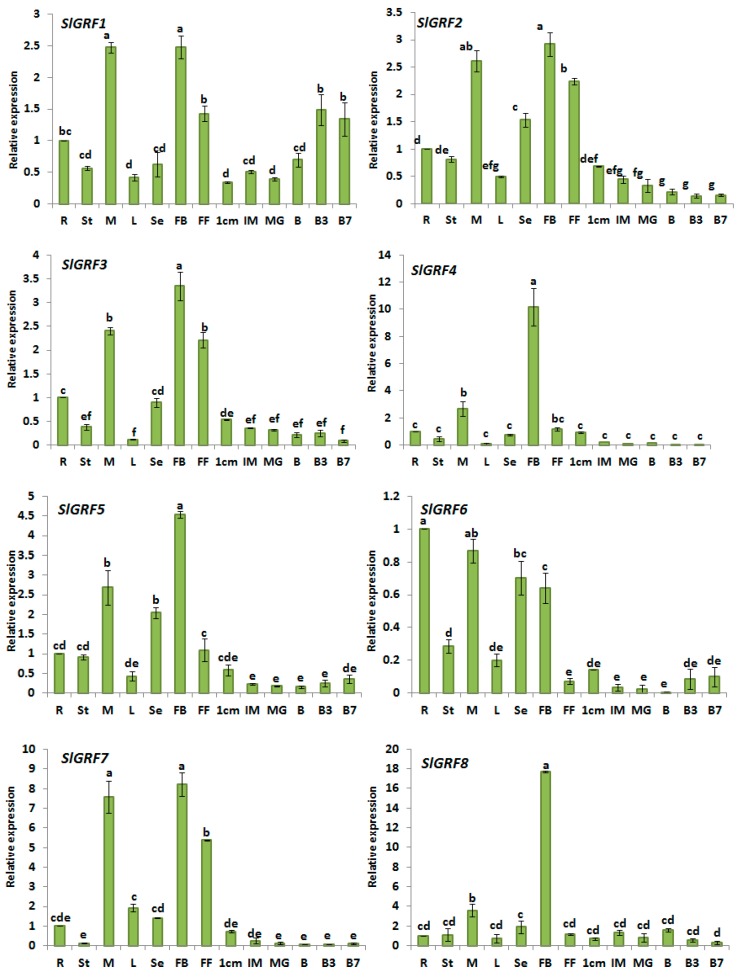
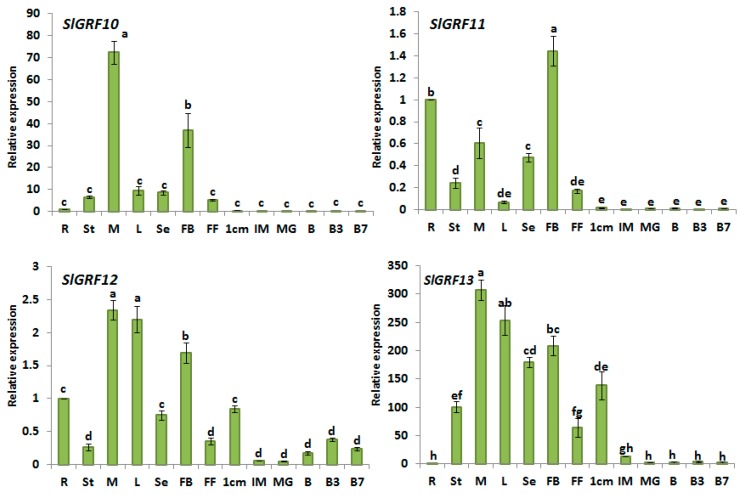
Figure 4.
Expression of SlGRF genes in different organs. Root (R), stem (St), meristem (M), leaves (L), seedling (Se), flower bud (FB), full blooming flower (FF), and fruits at six developmental stages (1 cm: 1 centimeter-sized fruit, IM: immature fruit, MG: mature green fruit, B: breaker, B3: three days after breaker, B7: seven days after breaker) were analyzed by quantitative reverse transcription polymerase chain reaction (qRT-PCR). Relative gene expression levels are normalized to EF1a (Elongation factor 1a) values. Error bars represent standard deviations of the means of three independent replicates. Statistically significant variations of expression and mean values at different sampling points (ANOVA, p ≤ 0.01 for all 12 genes) are indicated with different letters.


