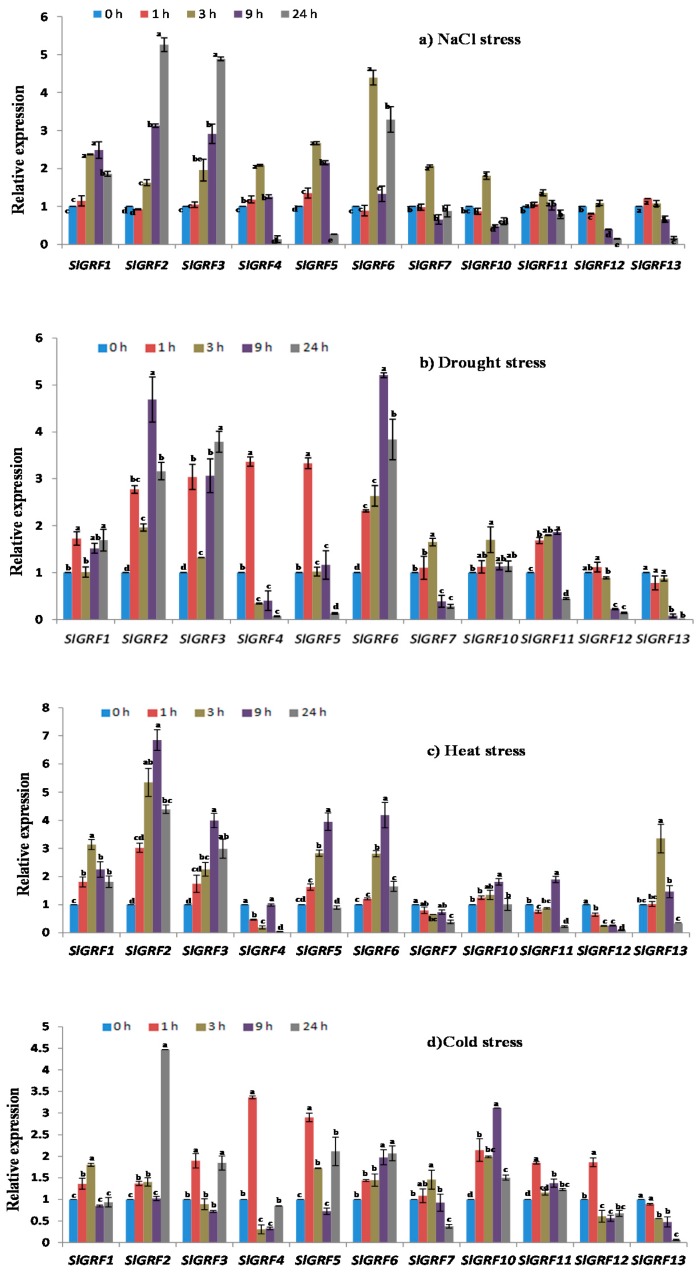
Figure 5.
Expression of SlGRF genes in response to abiotic stresses: (a) NaCl; (b) drought; (c) heat; and (d) cold, at 0–24 h. The error bars represent the standard error of the means of three independent replicates of qRT-PCR analysis. Different letters associated with each treatment indicate statistically significant difference at 5% level of significance, where the same letter indicates that the values did not differ significantly at p ≤ 0.05 according to Tukey’s pairwise comparison tests.

