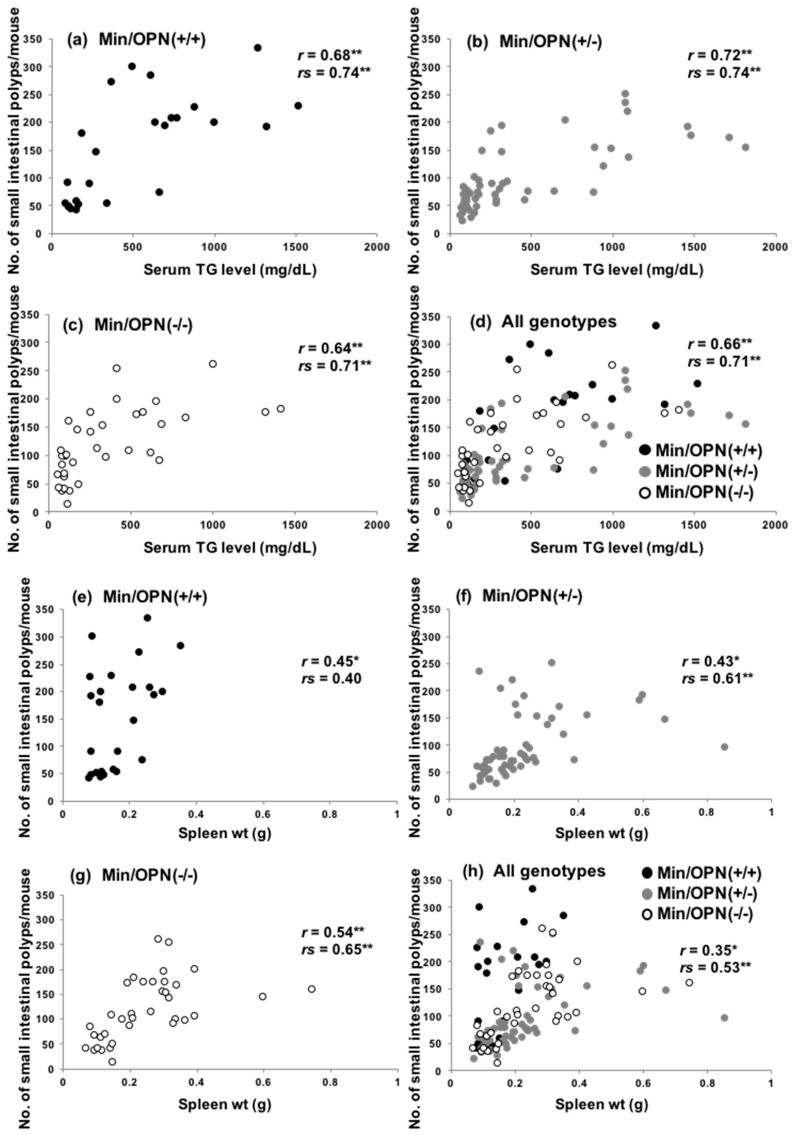
Figure 3.
Scatter plots of serum triglyceride (TG) levels and intestinal polyp number in (a) Min/OPN(+/+), (b) Min/OPN(+/−), and (c) Min/OPN(−/−) mice, and (d) all genotypes. Scatter plots of spleen weight and intestinal polyp number in (e) Min/OPN(+/+), (f) Min/OPN(+/−), and (g) Min/OPN(−/−) mice, and (h) all genotypes. r, the Pearson correlation coefficient; rs, Spearman’s rank correlation coefficient; *, **, the correlation was statistically significant at p < 0.005, and p < 0.0005, respectively.

