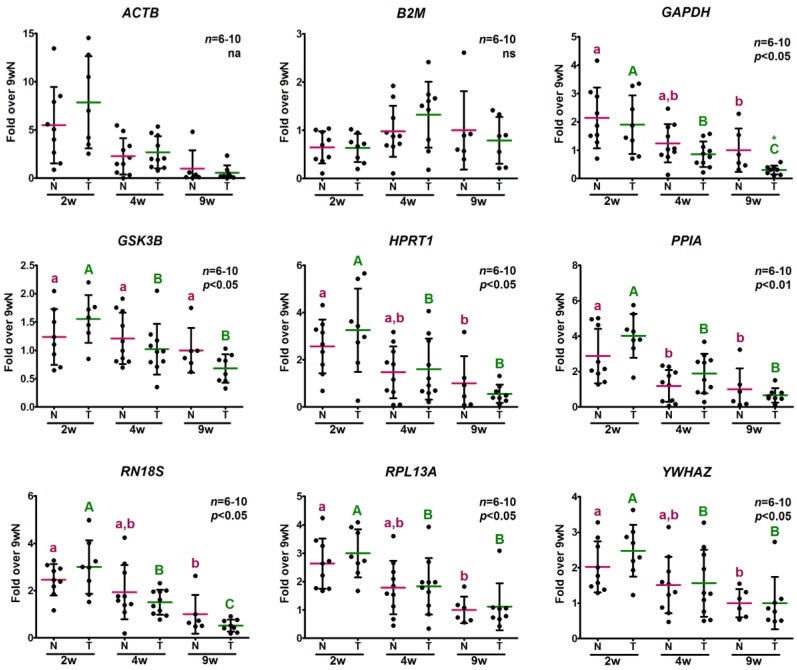
Figure 2.
Relative expression levels of potential reference genes determined for the same amount of total RNA. The relative expression levels of nine potential reference genes were determined by RT-qPCR in samples obtained from the same amount of reverse transcribed total RNA from skeletal muscle of 2-, 4- and 9-week-old (2, 4, 9 w) normal (N) and transgenic (T) mice. Data are the mean ± SD (standard deviation) of the indicated n number of samples per group, each one representing a different animal. Normal distribution was evaluated by the D’Agostino-Pearson test; B2M and GAPDH data were log-transformed to achieve normality. ACTB log-transformed data did not pass normality test and were not further analyzed (na). Normally distributed data were analyzed by two-way ANOVA followed by the Bonferroni post-test. Different letters denote significant differences by age; small letters correspond to normal mice and capital letters to transgenic animals. Asterisks indicate differences between genotypes. A p-value lower than 0.05 was considered statistically significant. na stands for not analyzed. ns stands for non-significant.

