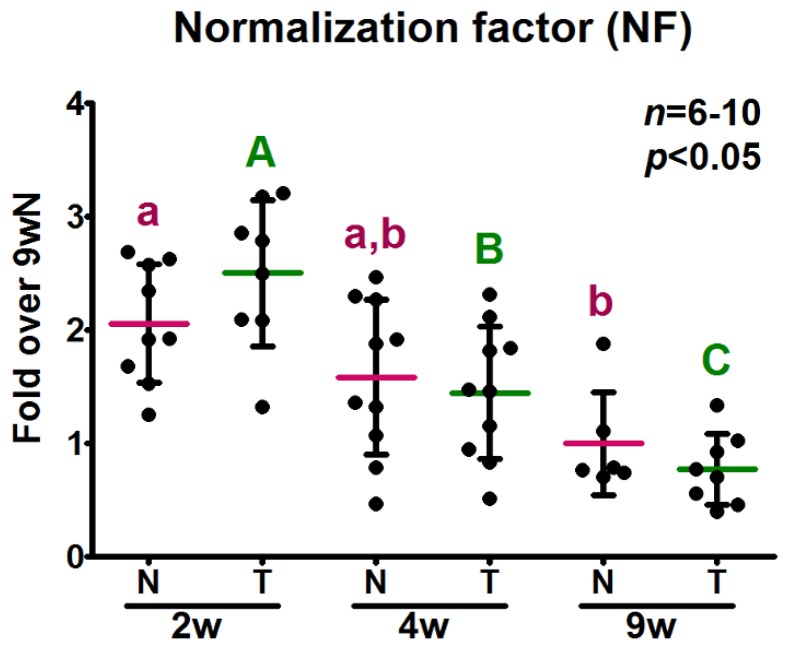
Figure 4.
Normalization factor calculated as the geometric mean of the most stable genes according to algorithms. The geometric mean of the relative expression levels of GSK3B, YWHAZ, RPL13A and RN18S, determined by RT-qPCR in samples obtained from the same amount of reverse transcribed total RNA from skeletal muscle of 2-, 4- and 9-week-old (2, 4, 9 w) normal (N) and transgenic (T) mice, was calculated for each sample to obtain the corresponding normalization factor. Data are the mean ± SD of the indicated n number of samples per group, each one representing a different animal. Normal distribution was confirmed by the D’Agostino-Pearson test before analysis by two-way ANOVA followed by the Bonferroni post-test. Different letters denote significant differences by age; small letters correspond to normal mice and capital letters to transgenic animals. A p-value lower than 0.05 was considered statistically significant.

