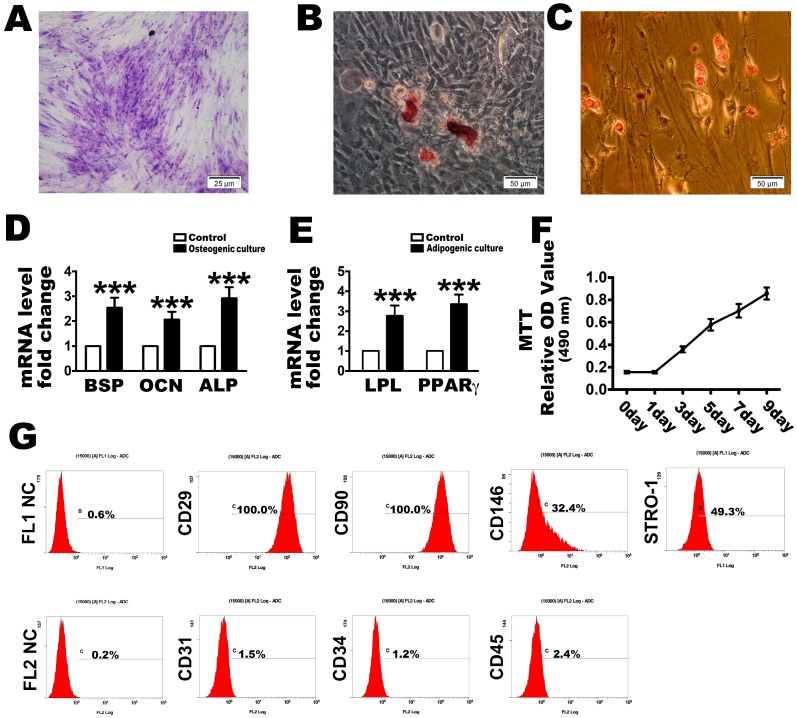
Figure 1.
Identification of human periodontal ligament stem cells (PDLSCs) used in this research. Representative image of colony-forming units and (A) a random single-cell clone on day 14. Bars = 25 µm; (B) Representative images of mineralized cell nodules following a 21-day osteogenic induction period and (C) lipid droplets following a 14-day adipogenic induction period. Bars = 50 µm; (D) Osteogenesis and (E) adipogenesis mRNA expression after the culture conditions compared with control; (F) Proliferation of locally isolated PDLSCs, as assessed by MTT assays after cultured at days 1, 3, 5, 7 and 9; (G) Cell surface markers identified by flow cytometric analysis. FL1 NC and FL2 NC means the negative control to the FL1 and FL2, respectively. The data are expressed as the mean ± SD. n = 5. *** p < 0.001 represent significant differences between the indicated columns.

