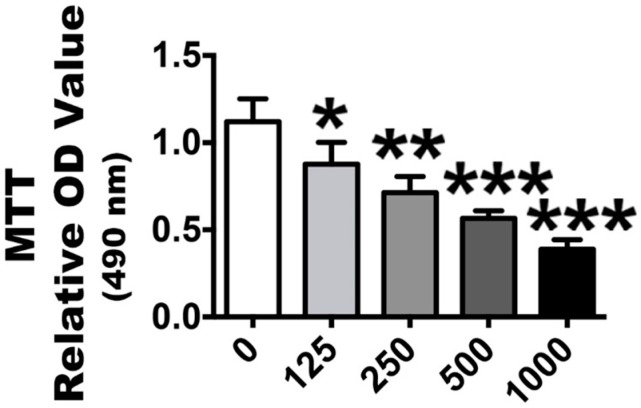
Figure 2.
Proliferation of passage 3 PDLSCs after H2O2 stimulation. The ability of cells proliferation was assessed by MTT assays. The columns represent the mean values with SD, n = 5. Different H2O2 concentration treatments containing 125, 250, 500 and 1000 µmol/L were compared with a 0 µmol/L control group. * p < 0.05, ** p < 0.01 and *** p < 0.001 represent significant differences between the indicated columns.

